After six straight months of negative comparisons, June airport rates were up $6.37 over last year.
by Staff
July 12, 2017
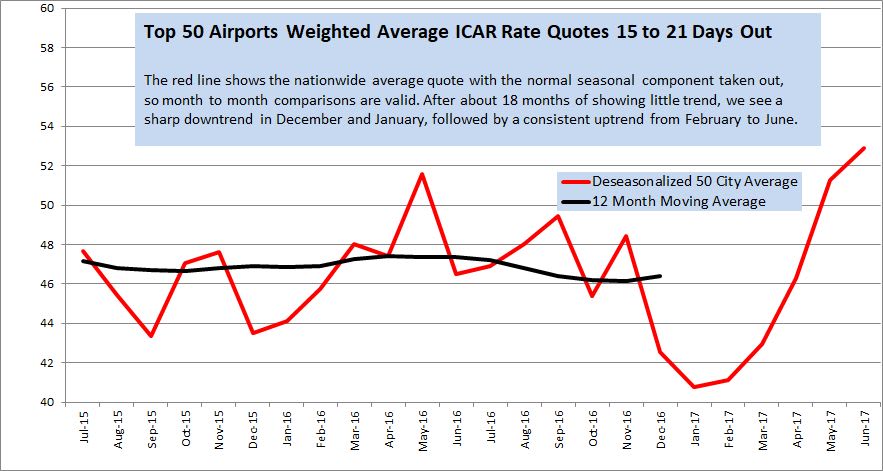
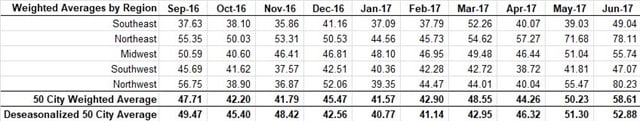
Rate data provided by Rate-Highway, a provider of revenue management services for the auto rental industry. Rates are a monthly average of weekly surveys of aggregator/OTA rates for vendors present in the markets listed on the date of the survey. These tables and graph show the average of all daily base rate quotes for an ICAR at the 50 largest U S airports weighted by deplanements, for arrivals 15 to 21 days ahead of the date of the survey, for two- and seven-day rentals.
1 min to read
In June, the rate quotes were up $6.37 from a year ago. The deseasonalized results for the last few months (the red line in the graph below) show a flattening trend before turning up, so there looks to be hope for a strong summer. The Midwest and Northeast regions showed strong rates in June at $9.64 and $16.01, respectively.
Brand Pricing
Ad Loading...
Brand pricing is tracked, and from time to time, updates are provided, particularly if there is an apparent change in pricing strategy.
The rates for the top three tier brands are usually close to each other. And for some time, National had been the highest or second highest —clearly not the price leader of the three.
However, six weeks ago that strategy may have changed. National Car Rental has gone from highest of the three brands to lowest, not ranking at the top once in the six-week period. This is opposed to being highest in 18 of the previous 23 weeks and never the lowest of the three in the whole 23-week period.
Rate data provided by Rate-Highway, a provider of revenue management services for the auto rental industry. Rates are a monthly average of weekly surveys of aggregator/OTA rates for vendors present in the markets listed on the date of the survey. These tables and graph show the average of all daily base rate quotes for an ICAR at the 50 largest U S airports weighted by deplanements, for arrivals 15 to 21 days ahead of the date of the survey, for two- and seven-day rentals.
Jim Tennant of The Tennant Group and Michael Meyer of Rate-Highway Inc. have been conducting rate surveys on a weekly basis and providing analysis and comments where appropriate. They publish this monthly recap in our electronic edition and more comprehensive looks in the print editions.
Weekly rate surveys of the top 50 U.S. airports have been conducted since mid-May 2013, so now there are four full years of history. This month, The Tennant Group and Rate-Highway are able to show results with the seasonal component adjusted.
They are also changing the way they calculate the monthly average quote from the weekly averages. In the future, all months will have the same number of weeks each year, and they have adjusted prior months to reflect this change.
Click here for a detailed description of the changes available for downloading.
Please contact Jim Tennant of The Tennant Group, jim@tennantgroup.com, 707-287-1311, with questions.
The Milan opening is part of Surprice Mobility's broader strategy to expand its corporate operations while increasing the use of technology across its network.
Japan's tourism industry, business travel market, and demand for vehicle rental services are reasons the country represents an important market for the company.
Regardless of your rental fleet size and structure, fleet managers, executives, and owners can gain valuable insights into an often-overlooked area of fleet operations.