


Travel Taxes: Best and Worst Cities Ranked in GBTA's 2012 Report
Chicago ranked the highest in the total tax burden, which includes sales tax and discriminatory taxes on car rentals, hotels and meals, while Fort Lauderdale, Fla. ranked the lowest.
Discriminatory travel taxes and fees enacted on travel-related services impose an average increased cost on visitors of 57% over general sales tax, according to new research released by the GBTA Foundation, the education and research arm of the Global Business Travel Association (GBTA).
Findings from the 2012 annual study of car rental, hotel and meal taxes in the top 50 U.S. travel destination cities found these taxes are often used to fund local projects unrelated to tourism and business travel.
“Cities and states must think carefully about the sales that local businesses will lose because of the higher costs that travel taxes impose,” said Joseph Bates, GBTA Foundation VP of research. “Tax rates that spike add another dimension for travel managers and local businesses. If spending one night in Chicago is 81% more expensive than visiting Ft. Lauderdale, for example, it can have an effect on where businesses decide to meet, hold events and spend their travel dollars.”
The top 50 markets are ranked in the study in two ways:
By overall travel tax burden, including general sales tax and discriminatory travel taxes.
By discriminatory travel tax burden, excluding general sales taxes to count only taxes that target car rentals, hotel stays and meals. Discriminatory travel taxes are targeted at travelers or travel-related areas and go above the general sales tax.
Total Travel Tax Burden
U.S. cities where travelers incur the lowest (left) and highest (right) total tax burden in central city locations, factoring in general sales taxes and discriminatory travel taxes:
Lowest total tax burden | Combined single day |
|---|---|
Fort Lauderdale, Fla. | $22.21 |
Fort Myers, Fla. | $22.21 |
West Palm Beach, Fla. | $22.21 |
Detroit, Mich. | $22.37 |
Portland, Ore. | $22.45 |
Orange County, Calif. | $22.79 |
Burbank, Calif. | $23.74 |
Ontario, Calif. | $24.08 |
Honolulu, Hawaii | $24.38 |
Orlando, Fla. | $24.50 |
U.S. cities where travelers incur the highest total tax burden in central city locations, factoring in general sales taxes and discriminatory travel taxes:
Highest total tax burden | Combined single day |
|---|---|
Chicago, Ill. | $40.31 |
New York, N.Y. | $37.98 |
Boston, Mass. | $34.83 |
Kansas City, Mo. | $34.58 |
Seattle, Wash. | $34.43 |
Minneapolis, Minn. | $34.32 |
Cleveland, Ohio | $34.22 |
Indianapolis, Ind. | $34.19 |
Nashville, Tenn. | $34.13 |
Houston, Texas | $33.51 |
Discriminatory Travel Tax Burden
Discriminatory travel taxes are those imposed specifically on travel services above and beyond general sales taxes. California boasts the lowest discriminatory travel tax rates in several central city locations.
U.S. cities with the lowest discriminatory travel tax rates in central city locations:
Lowest discriminatory | Discriminatory increase |
|---|---|
Burbank, Calif. | $1.81 |
Orange County, Calif. | $3.36 |
Ontario, Calif. | $4.66 |
San Diego, Calif. | $5.43 |
Los Angeles, Calif. | $5.95 |
Oakland, Calif. | $5.95 |
Fort Lauderdale, Fla. | $7.17 |
Fort Myers, Fla. | $7.17 |
Tampa, Fla. | $7.17 |
West Palm Beach, Fla. | $7.17 |
U.S. cities with the highest discriminatory travel tax rates in central city locations:
Highest discriminatory | Discriminatory increase |
|---|---|
Portland, Ore. | $22.45 |
Boston, Mass. | $19.17 |
Chicago, Ill. | $16.49 |
New York, N.Y. | $15.74 |
Minneapolis, Minn. | $15.45 |
Kansas City, Mo. | $15.21 |
Charlotte, N.C. | $14.88 |
Cleveland, Ohio | $14.79 |
Milwaukee, Wisc. | $14.76 |
Washington, D.C. | $14.68 |
The full list of fifty destinations is available exclusively to GBTA members by clicking here and non-members may purchase the report through the GBTA Foundation by emailing pyachnes@gbtafoundation.org.
More Rental Operations

The Desk Upsell Is Costing Operators More Than it Earns
Counter upsells generate revenue, but they can also slow transactions, erode trust, and cost repeat business. Fully inclusive pricing may offer operators a better path to long-term value.
Read More →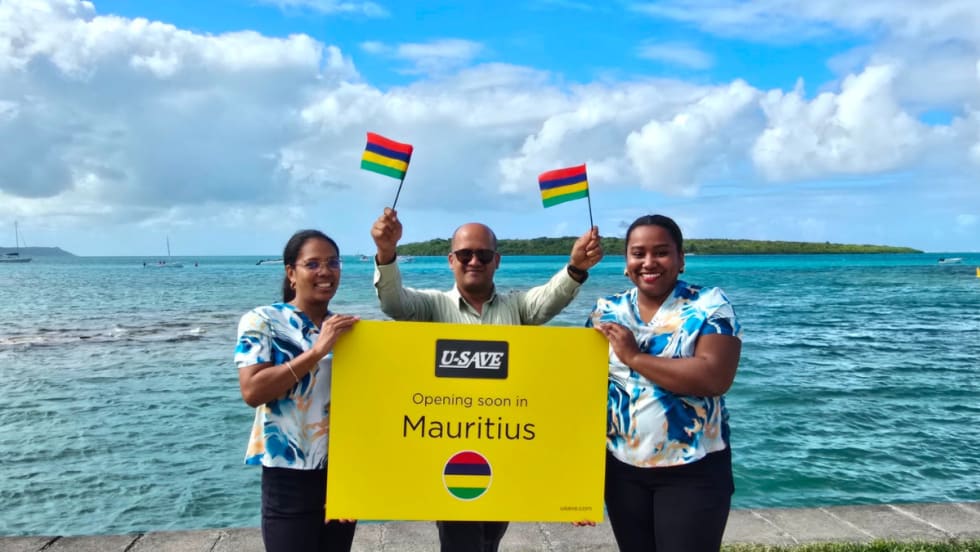
U-Save Expands Indian Ocean Presence with New Master Franchise for Mauritius
The franchise has been acquired by Mauritian travel entrepreneur Umarfarooq Omarjee, an established figure in the island's tourism and mobility sector.
Read More →
Global Carsharing Fleet Projected to Reach 768,000 Vehicles By 2030
A new Berg Insight forecast outlines several business models driving the projected growth in public carsharing worldwide through 2029.
Read More →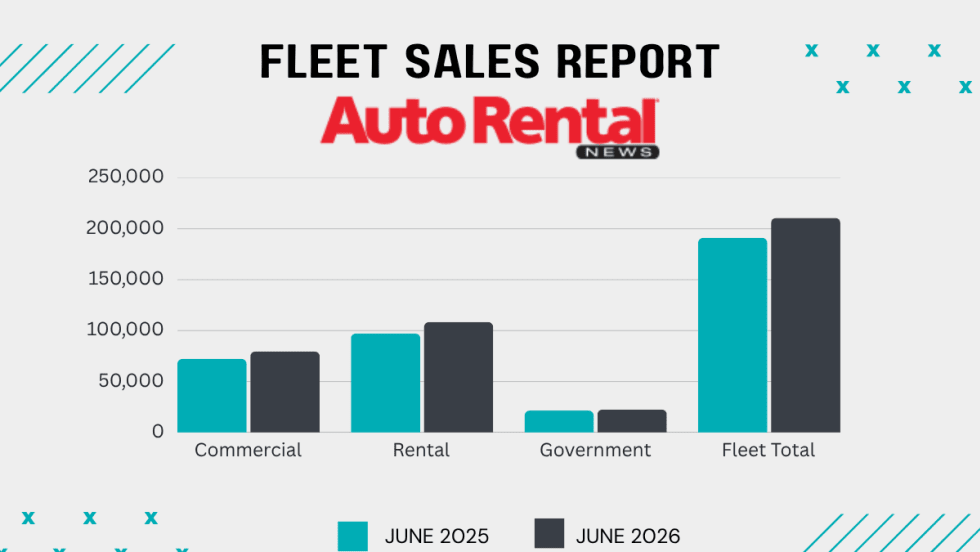
Rental Car Fleet Sales Show Mid-Year Strength
June gains ensured rental fleets closed out the first half of 2026 in positive territory.
Read More →
Surprice Mobility Opens Corporate Rental Station at Milan Malpensa Airport
The Milan opening is part of Surprice Mobility's broader strategy to expand its corporate operations while increasing the use of technology across its network.
Read More →
Brazilian Executive MBA Targets Growing Domestic Rental Car Industry
Rental car companies face a unique combination of challenges that are rarely addressed in traditional programs.
Read More →
Green Motion Expands Into Japan With Master Franchise Agreement
Japan's tourism industry, business travel market, and demand for vehicle rental services are reasons the country represents an important market for the company.
Read More →
ACRA Carrying Fuller Industry Load As AI and EVs Lurk In Future
The leading car rental professional business group details an active legislative, regulatory, and macro-trends agenda affecting car rental operators.
Read More →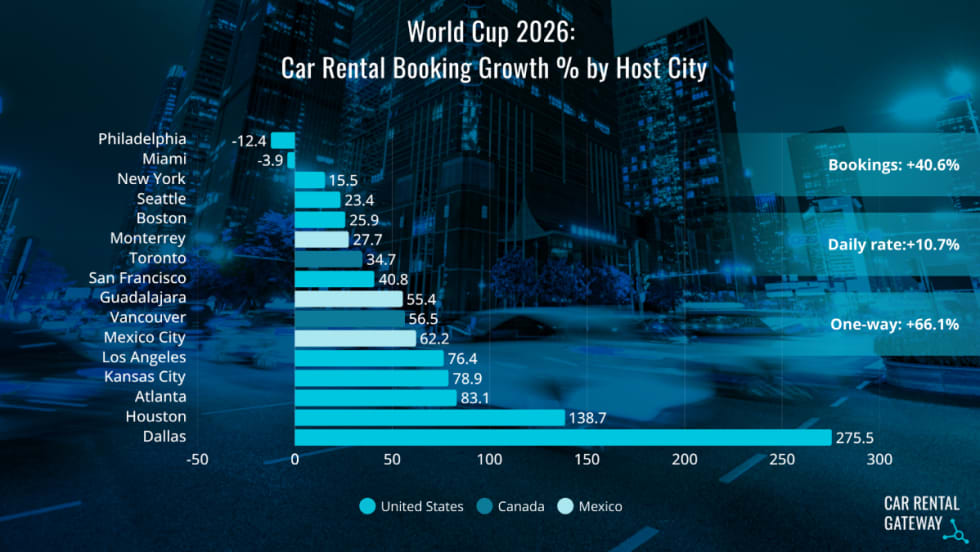
World Cup Travel Data Shows Longer Car Rentals and More One-Ways
A recent analysis of FIFA bookings found varied demand patterns that influenced rental car pricing.
Read More →
A Leveling Force: AI Morphs Into A Rental Car Profit-Seeker
Revenue managers can’t match the emerging AI tools gobbling lots of data that could counter the competitive race to the rate bottom.
Read More →