
Wholesale Used-Vehicle Prices and Sales Holding Steady
With sales slightly stronger than expected, tight supply, and prices at about 6% below last year, these factors are expected to prevent any substantial decline in wholesale prices through year-end.

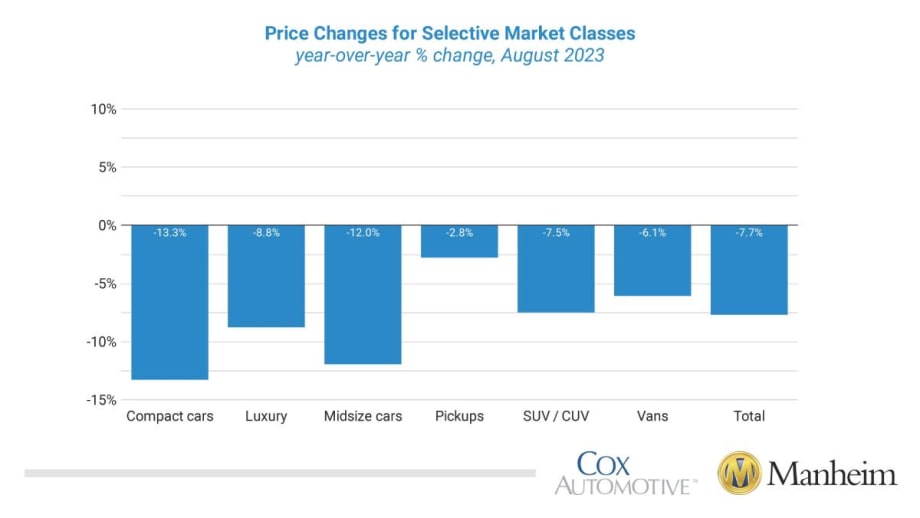
Compared to August 2022, pickups, vans, and SUVs lost less than the industry, down 2.8%, 6.1%, and 7.5%, respectively. Compact cars performed the worst year over year, down 13.3%, followed by midsize cars at 12%, and luxury down 8.8%.
Graphic: Cox Automotive / Manheim
Wholesale used-vehicle prices (on a mix, mileage, and seasonally adjusted basis) increased 0.2% in August from July, according to a report from Cox Automotive and Manheim released Sept. 8.The Manheim Used Vehicle Value Index (MUVVI) rose to 212.2, down 7.7% from a year ago.
“Like last month’s note, the current Manheim Index level of 212.2 is barely above that of the 212.1 measure seen in August 2021,” said Chris Frey, senior manager of economic and industry insights for Cox Automotive, in a recent news release. “Used market conditions have been quite consistent for a few months and are not likely to change much, even with the larger push toward balance; sales are slightly stronger than expected, inventory remains tight, and prices are holding at levels around 6% below last year at the same time. These factors are expected to prevent any substantial decline in wholesale prices through year-end.”
The seasonal adjustment minimized August’s increase. The non-adjusted price change in August increased by 0.9% compared to July, moving the unadjusted average price down 7.5% year-over-year. In August, Manheim Market Report (MMR) values saw below-average weekly declines as the month started and ended, with increases in between. Over the last four weeks, the Three-Year-Old Index increased an aggregate 0.2%.
During August, daily MMR Retention, which is the average difference in price relative to the current MMR, averaged 99.3%, meaning market prices were slightly below MMR values. The average daily sales conversion rate increased to 57.5%, which is much closer to normal for the time of year and higher than what was recorded over the last three months. For context, the daily sales conversion rate averaged 60% in August 2019.
Buying activity increased in the month, while supply remained limited. The sales conversion rate in August was higher than in July at 48.9%. August 2022 saw a 49.9% rate.
The major market segments again produced seasonally adjusted prices that were lower year over year in August.
Compared to August 2022, pickups, vans, and SUVs lost less than the industry, down 2.8%, 6.1%, and 7.5%, respectively. Compact cars performed the worst year over year, down 13.3%, followed by midsize cars at 12%, and luxury down 8.8%.
Compared to last month, pickups gained more than the industry, up 0.6%, as did vans, at 1.2%. Both compact and midsize cars lost against the industry in August, down 0.6% and 0.5%, respectively. Luxury and SUVs gained little, both up 0.1% from last month.
Used Retail Vehicle Sales Increased in August
Assessing retail vehicle sales based on observed changes in advertised units tracked by vAuto, Cox estimates that used-vehicle retail sales in August were up 5% compared to July, and the year-over-year comparison with 2022 improved.
Used retail sales are estimated to be up 0.8% year-over-year in August, which was the best performance since February.
The average retail listing price for a used vehicle moved down 0.4% over the last four weeks. Using estimates of used retail days’ supply based on vAuto data, an initial assessment indicates August ended at 43 days’ supply, down six days from 49 days at the end of July, and nine days lower than how August 2022 ended at 52 days.
Leveraging Manheim sales and inventory data, wholesale supply is estimated to have finished July at 24 days, down three days from the end of July and down five days from August 2022’s estimate of 30 days.
August’s total new-light-vehicle sales were up 17.1% year over year, with one more selling day versus August 2022.
By volume, August new-vehicle sales were up 2.2% month over month. The August sales pace, or seasonally adjusted annual rate (SAAR), came in at 15 million, an increase of 13.6% from last year’s 13.2 million but down 4.5% from July’s virtually unrevised 15.7 million pace.
Combined sales into large rental, commercial, and government fleets increased 34% year over year in August. Sales into rental fleets were up 102% year over year, sales into commercial fleets were up 1.2%, and sales into government fleets were up 39%. The fleet market share was estimated to be 15.6%, a gain of 2.2% over last year’s share but down 0.4% from July’s 16% market share.
Including an estimate for fleet deliveries into dealer and manufacturer channels, the remaining retail sales were estimated to be up 13.9%, leading to an estimated retail SAAR of 12.6 million, up 0.9 million from last year’s 11.5 million pace and down 0.6 million from last month’s 13.2 million pace.
Rental Risk Prices Mixed, Mileage Down in August
The average price for rental risk units sold at auction in August declined 5.9% year over year. Rental risk prices increased by 1.4% compared to July. Average mileage for rental risk units in August (at 55,100 miles) was down 2.5% compared to a year ago and down 9.0% from July.
Measures of Consumer Confidence Declined in August
The Conference Board Consumer Confidence Index declined by 6.9% in August, as views of both the present situation and future expectations declined. Consumer confidence was up 2.4% year-over-year. Plans to purchase a vehicle in the next six months declined modestly but remained up year over year.
The confidence index did not fall as much during the pandemic as the sentiment index from the University of Michigan.
Both series declined in August after improving in June and July. The Michigan index declined 2.9% for the month but was up 19% year over year. The consumer’s view of vehicle-buying conditions was unchanged from July and at the best level since February.
The daily index of consumer sentiment from Morning Consult also measured declining sentiment in August, as the index declined 2.3% from the end of July.
Expectations of the future improved the most in June and July but lost ground in August. Gas prices increased in July and again in August but saw some relief in the final 10 days of August. The national average price for unleaded gas increased 1% in August to $3.82 per gallon, which was unchanged year-over-year, according to AAA.
Originally posted on Vehicle Remarketing
More Remarketing
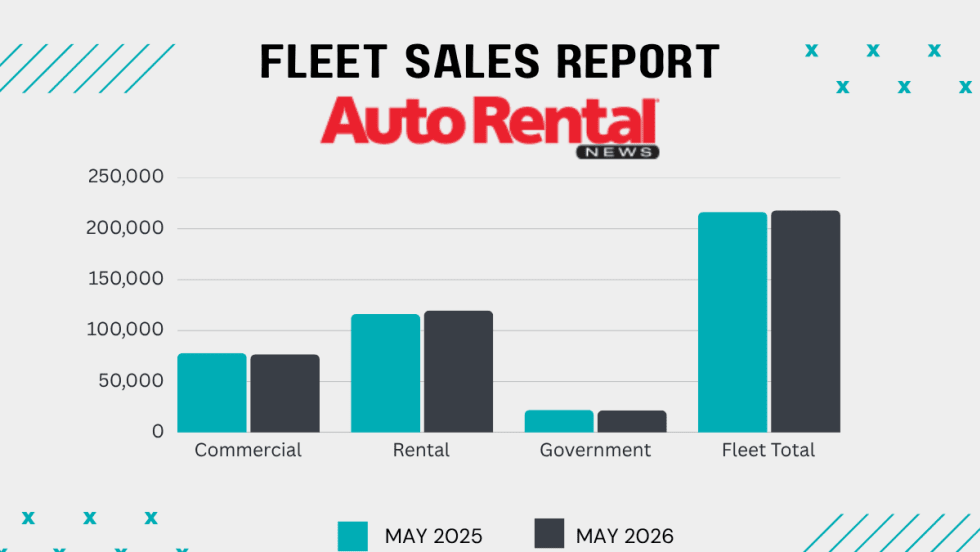
Rental Fleet Sales Skating Just Above 2025 Levels
The U.S. economy's continued growth and positive business investment are creating a favorable environment for fleet vehicle demand.
Read More →
Cross-Pressures, Evolving Trends Drive 2026 Rental Car Industry
A combination of cautious economic behavior, shifts in the rental vehicle market, and technological influences are shaping car rental operator decisions.
Read More →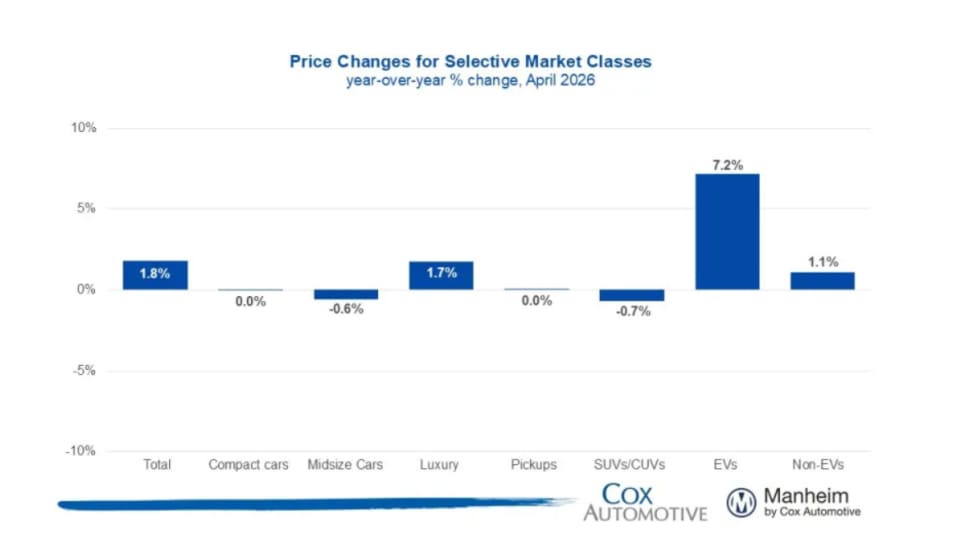
Wholesale Used Vehicle Prices Slightly Up In April
The Iranian conflict and rising gas prices inject much uncertainty into the future wholesale used vehicle markets, as higher gas prices soak up spendable income from vehicle buyers.
Read More →
Surprice Opens Two Rental Branches In Japan
The launch highlights the global car rental operation’s growing presence in Asia.
Read More →
Wholesale Used Vehicle Prices Up In February
Solid demand at Manheim auctions with higher sales conversion rates indicate an appetite from dealers to buy.
Read More →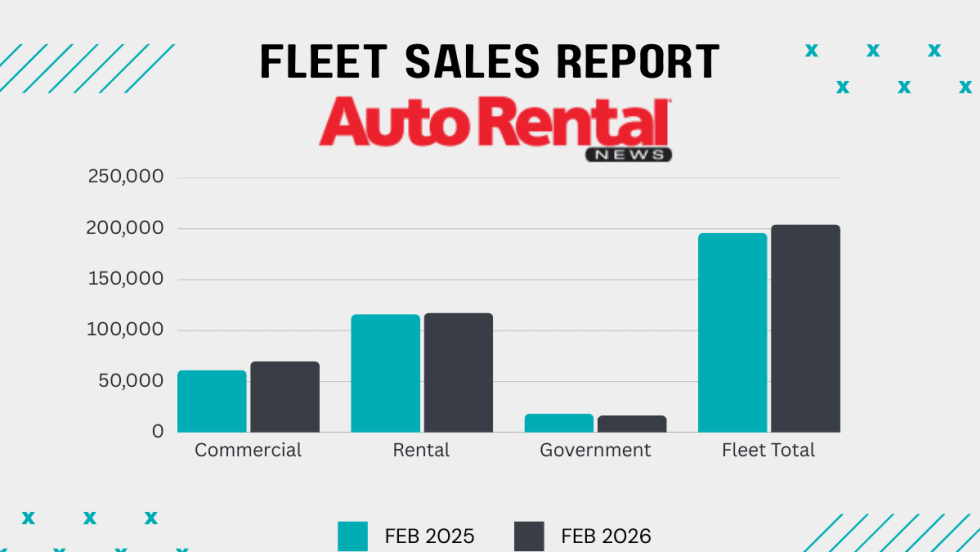
Rental Fleet Sales Slow In February Ending A Strong Streak
Commercial fleets posted the most gains, sustaining increases in monthly and year-to-date fleet sales
Read More →
Avis Budget Group Reports Near $1 Billion Loss Tied To 2025 EV Fleet Write-Down
Following Hertz, the company is the second global car rental conglomerate to sustain sizable losses due to lower customer demand and usage of electric rental cars.
Read More →
2025 Rental Vehicle Remarketing Summary And Outlook
The year brought modest and flatter results across wholesale values, total off-rental supply, and rental risk units.
Read More →
Auctions Record Highest Vehicle Sales Since 2019
2025 figures show a steady recovery in wholesale vehicle activity this decade.
Read More →
DriveItAway Holdings, Free2move Launch Operations In Nine Cities
The co-branded program with Stellantis’ mobility division scales up leasing and financing options nationwide with more cities to come online in 2026.
Read More →