

New Vehicle Supply Spikes, Affordability Surges
Inventory levels reach the highest point since June 2020 while the number of buyers who can afford a new vehicle is the best since June 2021.


Many domestic makes had the highest inventory. Brands with the lowest supply were Asian imports.
Source: Cox Automotive
February opened with 80 days of new-vehicle supply across the industry, the highest since June 2020, according to Cox Automotive’s analysis of vAuto Available Inventory data released Feb. 15.
At the start of February, the total U.S. supply of available unsold new vehicles was 2.61 million units. That is 870,000 units – or 50% – above a year ago. Inventory was down from 2.66 million at the start of January.
Day’s supply at the start of January hit 80, up 38% from the same time a year ago. The last time days’ supply crossed the 80-days mark was June 1, 2020, when it was 83 days’ supply.
The Cox Automotive days’ supply is based on the daily retail sales rate for the most recent 30-day period, which ended Feb. 5. Sales during that period ran 9% ahead of a year ago. For the full month of January, new-vehicle sales decreased to a 15 million seasonally adjusted annual rate (SAAR), the lowest sales pace since last March due partly to harsh winter weather that disrupted sales in what is typically the lightest sale volume month of the year.
Domestic Automakers Have Highest Inventory Levels
Many domestic makes had the highest inventory. Dodge had the highest of any make by a wide margin, followed by Chrysler, Lincoln and Ram. Brands with the lowest supply were Asian imports. Toyota had the lowest at 36 days of supply, followed by Honda, Lexus and Mazda. Cadillac was at the low end as well.
Of the top-selling 30 models, the ones with the lowest inventory were mostly Toyota and Honda models. The new Toyota Grand Highlander had the lowest, followed by the Ford Maverick, which comes standard as a hybrid. The new Chevrolet Trax was also at the low end.
At the other end of the spectrum, pickup trucks, led by the Ram 1500, and SUVs, led by the Ford Bronco Sport, had the highest inventory.
The average new-vehicle listing price opened February at $47,142, down 1% from a year ago. The average listing price rose throughout December 2023 and started January high, but prices began declining in the second week of January and have been dropping by almost 1% a week.
The U.S. new-vehicle average transaction price in January was $47,401, down nearly 4% from a year ago and down almost 3% from December 2023, according to Kelley Blue Book. (The month of December, when luxury vehicle sales typically surge, often sees a jump in average transaction prices.) Discounts and incentives in January averaged 5.7% of ATP, up from 5.5% in December and nearly 100% higher than a year ago.
New Vehicle List and Transaction Prices Dip
Trends in new-vehicle affordability factors moved in support of consumers in January, leading to better affordability compared to December and much improvement year over year, according to the Cox Automotive/Moody’s Analytics Vehicle Affordability Index.
“Just as new-vehicle affordability improved in January to its best level in over two years, access to auto credit moved in the other direction,” said Cox Automotive chief economist Jonathan Smoke in a news release. “Income growth continued while both the average new-vehicle price and the average interest rate declined making new vehicles more affordable. However, we saw credit access to auto credit decline to its lowest level since August 2020.”
The typical payment declined 3.2%, and the number of median weeks of income needed to purchase the average new vehicle declined to 37.5 weeks from an upwardly revised 38.8 weeks in December. The January number of weeks was the lowest since August 2021.
Originally posted on Automotive Fleet
More Fleet Acquisition

Global Carsharing Fleet Projected to Reach 768,000 Vehicles By 2030
A new Berg Insight forecast outlines several business models driving the projected growth in public carsharing worldwide through 2029.
Read More →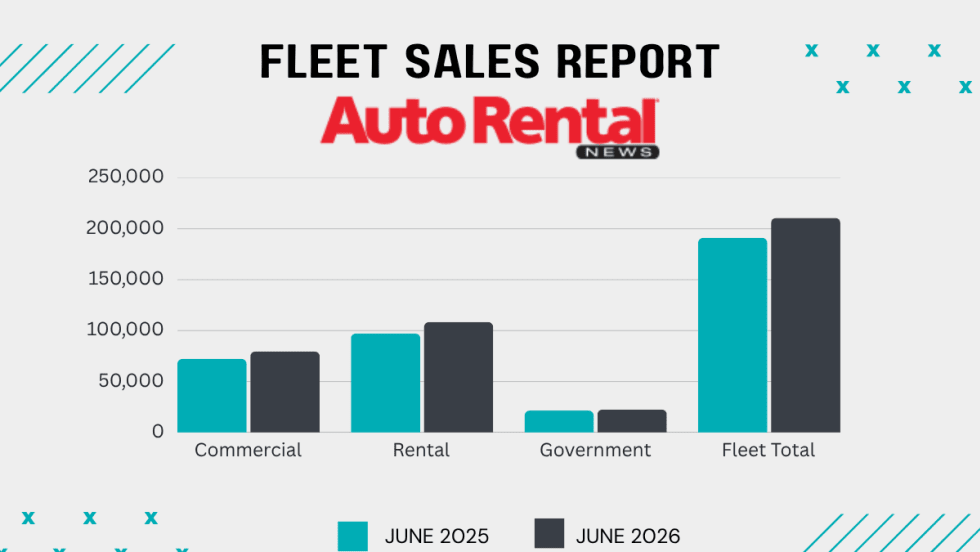
Rental Car Fleet Sales Show Mid-Year Strength
June gains ensured rental fleets closed out the first half of 2026 in positive territory.
Read More →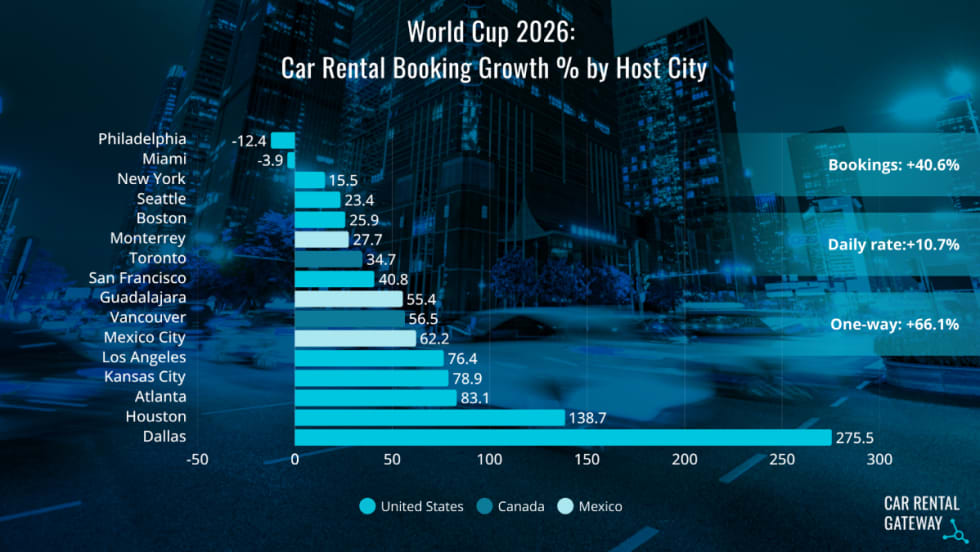
World Cup Travel Data Shows Longer Car Rentals and More One-Ways
A recent analysis of FIFA bookings found varied demand patterns that influenced rental car pricing.
Read More →
A Leveling Force: AI Morphs Into A Rental Car Profit-Seeker
Revenue managers can’t match the emerging AI tools gobbling lots of data that could counter the competitive race to the rate bottom.
Read More →
Rethink The Future To Avert A Race To The Bottom
Rental car operators heard a sobering industry message and a stern challenge at the close of the International Car Rental Show.
Read More →
DriveItAway, Free2move Plan Shared Fleet Program for Independent Rental Fleet Operators
Vehicles would be placed with participating rental operations to support car renter demand and provide additional fleet capacity.
Read More →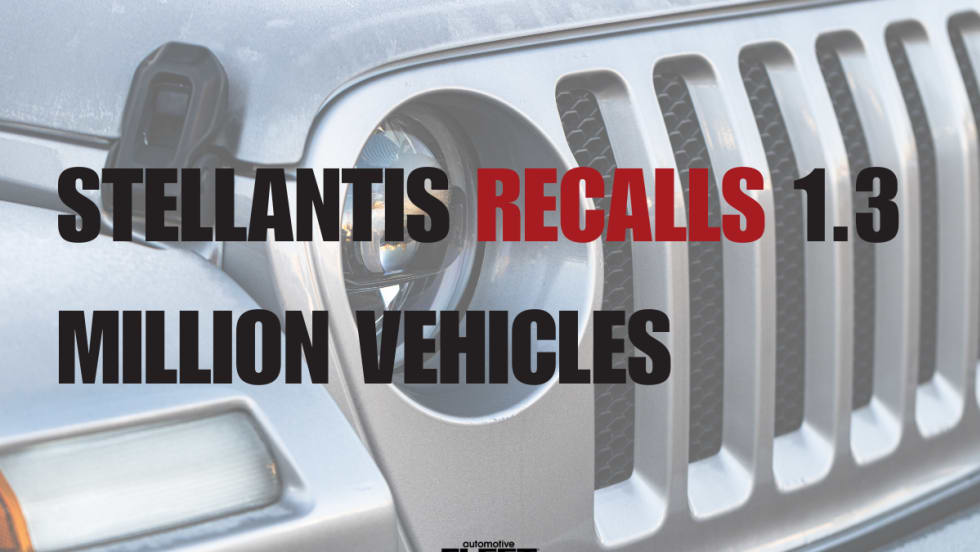
Stellantis Recalls 1.3 Million Jeep Vehicles Worldwide Over Fire Risk
Stellantis is recalling more than 1.3 million Jeep Wrangler and Gladiator models worldwide over a fire risk linked to power steering pump wiring.
Read More →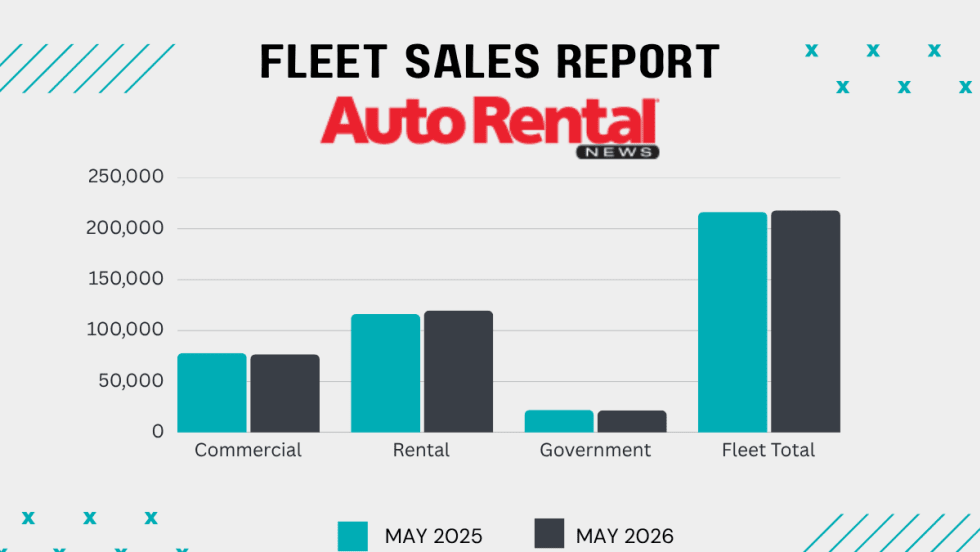
Rental Fleet Sales Skating Just Above 2025 Levels
The U.S. economy's continued growth and positive business investment are creating a favorable environment for fleet vehicle demand.
Read More →
Get Ready To Roll: No Stopping Self-Driving Rental Cars
The autonomous mobility technology revolution will move at its own pace, but sooner rather than later.
Read More →
Cross-Pressures, Evolving Trends Drive 2026 Rental Car Industry
A combination of cautious economic behavior, shifts in the rental vehicle market, and technological influences are shaping car rental operator decisions.
Read More →