


Related News:Wholesale Used Vehicle Prices Rose In 2025
Wholesale Used Vehicle Prices Up In February
Solid demand at Manheim auctions with higher sales conversion rates indicate an appetite from dealers to buy.
March 6, 2026
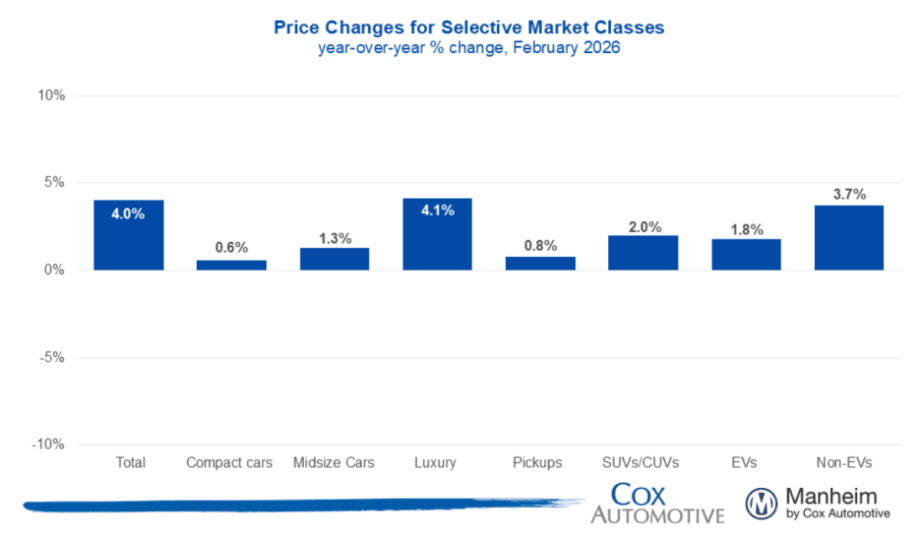
Overall market prices were notably higher than a year ago, led by the luxury segment and non-electric vehicles, while compact cars and trucks posted the weakest gains.
Credit: Cox Automotive
3 min to read
The Manheim Used Vehicle Value Index (MUVVI) rose to 212.3, reflecting a 4% increase for wholesale used-vehicle prices (adjusted for mix, mileage, and seasonality) compared to February 2025, according to Cox Automotive figures released March 6.
The February index is up 0.8% month over month. The long-term average monthly move for February is a decrease of 0.2%.
Non-adjusted wholesale vehicle prices are now up 4.2% year over year and 3% from January 2026. The long-term average monthly move in non-adjusted values is an increase of 0.9% in February.
“Since the start of 2026, we’ve seen mostly solid demand at Manheim with higher sales conversion rates indicating an appetite from dealers to buy. As we progressed through February, we saw prices rise above usual levels, especially in the back half of the month," said Jeremy Robb, chief economist of Cox Automotive, in a March 6 news release. "Now that we are officially in March, with warmer weather ahead across much of the U.S., we have seen retail demand increasing in our most recent data points – for both new and used sales."
Robb said the average tax refund is running 10% higher this year, as consumer filings peak in the coming weeks and will likely generate more traffic at dealerships in March.
However, "recent geopolitical events introduce new risks to the economy, and that may dampen the consumer appetite in the short run, as people digest the news in the Middle East," he added. "This could slow the rising pace we see during tax refund season, particularly as gas prices rise."
MMR Prices, Retention & Sales Conversion
MMR prices for the Three-Year-Old Index increased 3.1% in February.
MMR retention averaged 100.3%, reflecting a 0.3-percentage-point increase both year over year and month over month.
Sales conversion was 61.5% for the period, 0.4 percentage points higher than the most recent three-year average for February and up 1.4 percentage points from January.
Takeaway: MMR prices for the Three-Year-Old Index increased more than is typical for this period. MMR retention increased slightly and is seasonally strong for this time of year. Meanwhile, sales conversion indicates strengthening demand, which has been consistently increasing since November and remains above usual levels for this time of year.
Segment Performance: Year-Over-Year Price Changes
Overall market prices were notably higher than a year ago, led by the luxury segment and non-electric vehicles, while compact cars and trucks posted the weakest gains.
Takeaway: All major vehicle segments are above year-earlier levels; however, the luxury segment continues to outperform the overall market. Continued strength in this segment has been observed throughout the past year. Compact cars and trucks continue to see relatively weak price growth compared to this time last year.
Wholesale Supply Declines
Wholesale supply: At the end of February, wholesale days’ supply fell to 26.7 days, higher by 0.6 days year over year and lower by 0.1 days compared to January.
Rental prices: Prices for rental vehicles are higher by 9.1% year over year, as they climbed in February, up by 6% from January. Rental values on a non-seasonally adjusted basis are 8.6% above 2025’s level and rose 7.1% in February, driven by lower average mileage, down 25.2% against last February overall.
Takeaway: Before the pandemic, the average wholesale vehicle days’ supply was 31 at the end of February. Days’ supply in February was below historical norms but declined less than is typical for January.
Topics:Used Vehicle PricesManheim IndexWholesale ValuesUsed Vehicle SalesWholesale VehiclesRemarketing
Originally posted on Automotive Fleet
More Remarketing
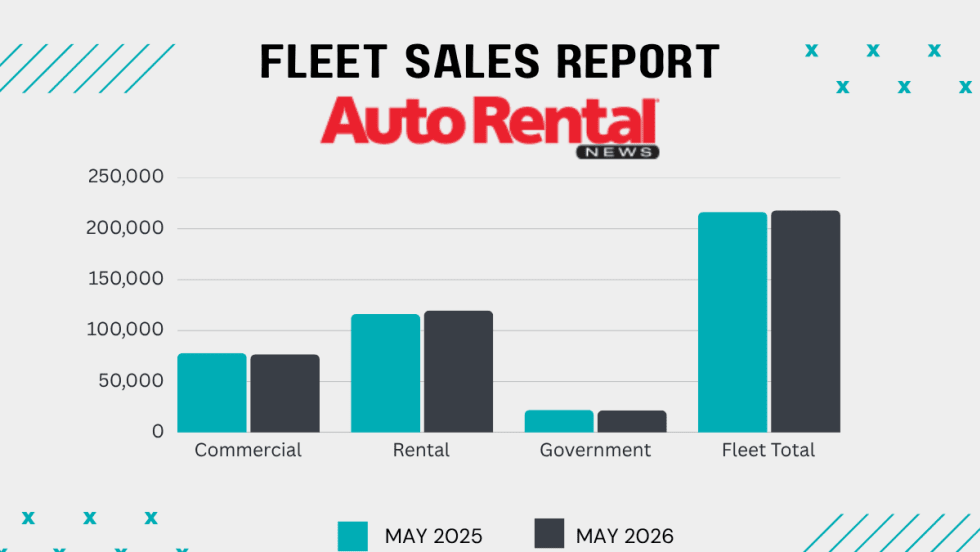
Rental Fleet Sales Skating Just Above 2025 Levels
The U.S. economy's continued growth and positive business investment are creating a favorable environment for fleet vehicle demand.
Read More →
Cross-Pressures, Evolving Trends Drive 2026 Rental Car Industry
A combination of cautious economic behavior, shifts in the rental vehicle market, and technological influences are shaping car rental operator decisions.
Read More →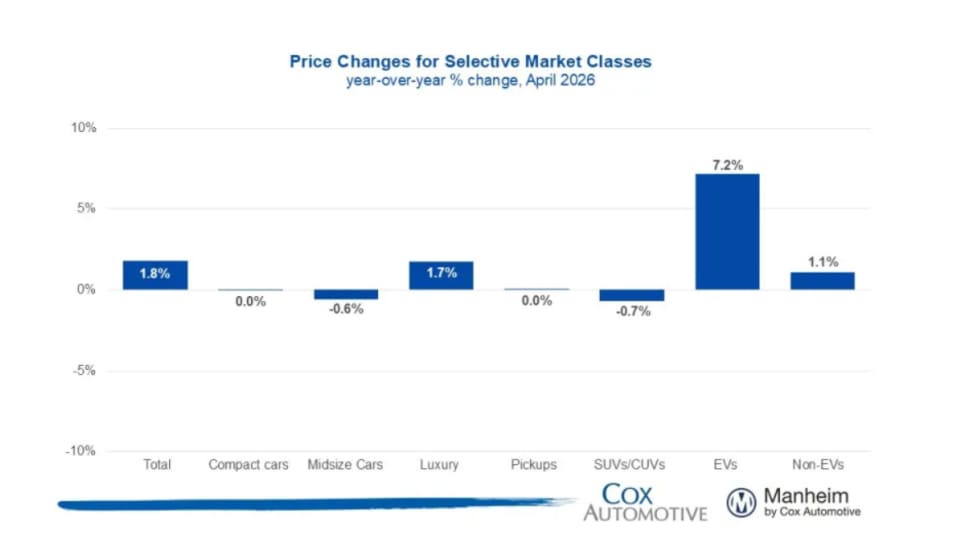
Wholesale Used Vehicle Prices Slightly Up In April
The Iranian conflict and rising gas prices inject much uncertainty into the future wholesale used vehicle markets, as higher gas prices soak up spendable income from vehicle buyers.
Read More →
Surprice Opens Two Rental Branches In Japan
The launch highlights the global car rental operation’s growing presence in Asia.
Read More →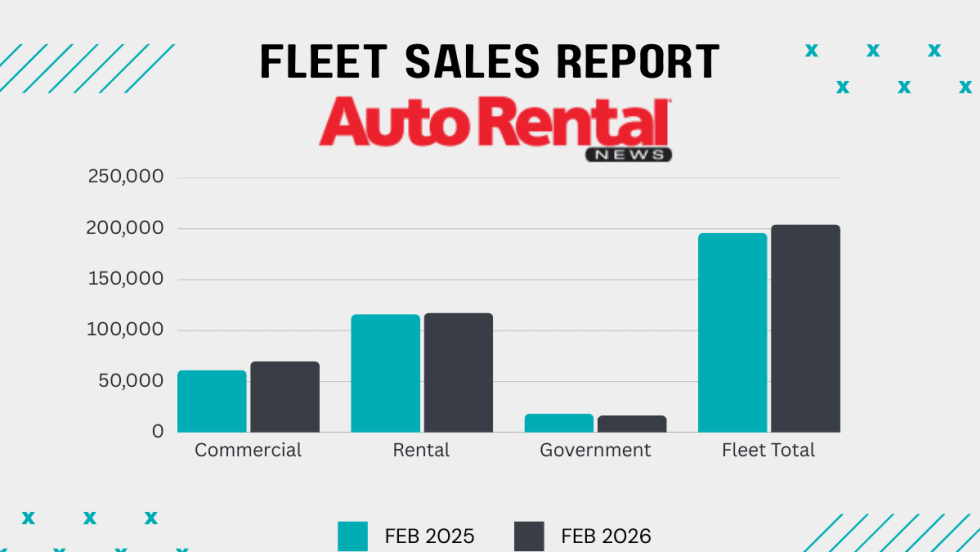
Rental Fleet Sales Slow In February Ending A Strong Streak
Commercial fleets posted the most gains, sustaining increases in monthly and year-to-date fleet sales
Read More →
Avis Budget Group Reports Near $1 Billion Loss Tied To 2025 EV Fleet Write-Down
Following Hertz, the company is the second global car rental conglomerate to sustain sizable losses due to lower customer demand and usage of electric rental cars.
Read More →
2025 Rental Vehicle Remarketing Summary And Outlook
The year brought modest and flatter results across wholesale values, total off-rental supply, and rental risk units.
Read More →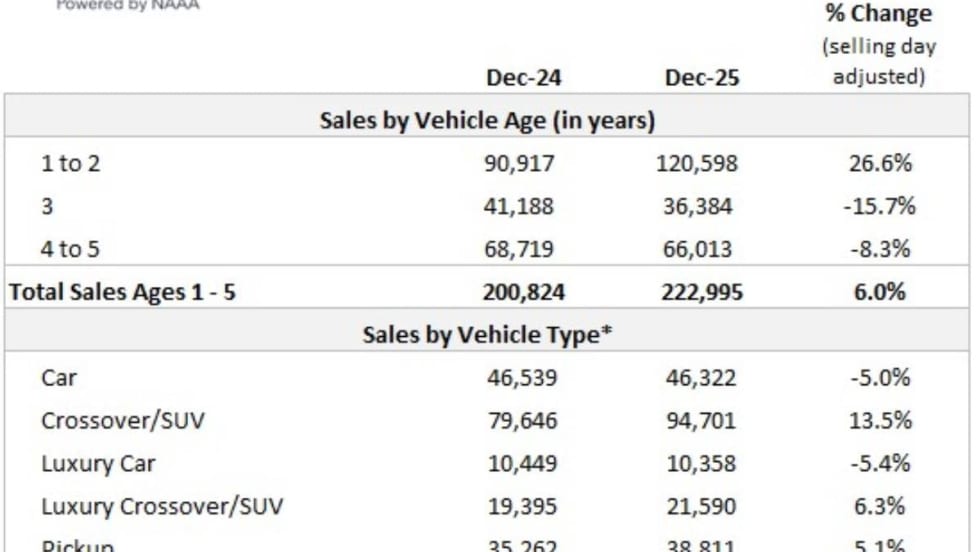
Auctions Record Highest Vehicle Sales Since 2019
2025 figures show a steady recovery in wholesale vehicle activity this decade.
Read More →
DriveItAway Holdings, Free2move Launch Operations In Nine Cities
The co-branded program with Stellantis’ mobility division scales up leasing and financing options nationwide with more cities to come online in 2026.
Read More →
Tariffs, Digital Tech, Industry Stats Among Top 10 Remarketing Topics for 2025
The annual look at most-consumed vehicle remarketing content shows what audiences think mattered the most in the mid-decade year.
Read More →