


ALG Predicts Gain for Detroit 3 in Residual Values
While 2009 was one of the roughest roads the auto industry has traveled, the road ahead looks more promising for the Detroit 3 with on average gain of approximately 3 percentage points in the 36-month residual outlook.
Automotive Lease Guide’s Detroit 3 Outlook
GM and Chrysler required a hefty infusion of tax-dollars to stay alive in 2009. As part of its federal financing deal, Chrysler was required to form a strategic alliance with Italian automaker Fiat. Ford, the sole bailout exception, avoided bankruptcy, and of the three Detroit automakers performed well in 2009.
Yet overall U.S. auto sales in 2009 dropped to 10.4 million units, down from 13.1 million in 2008. Even though the Cash for Clunkers program was popular with approximately 700,000 cars sold, foreign automakers benefited more than U.S. automakers in 2009.
In 2010, sales performance is showing new signs of life for the Detroit 3. GM was up 14 percent year-over-year and Ford performed with sales growth of 25 percent year-over-year in January 2010. On the other hand, Chrysler was down 8 percent year-over-year, while Toyota and Honda experienced a sales decline of 16 percent and 5 percent year-over-year, respectively. However, the overall industry posted a sales gain of approximately 6 percent year-over-year.
General Motors
At the start of 2009, GM had eight brands. It has since dropped or sold off Hummer, Pontiac, Saab and Saturn. In 2010 and forward, GM is focusing on its four core brands (GMC, Chevrolet, Buick, Cadillac). While shedding less performing brands as well as exiting bankruptcy swiftly, the impact on perception has been less visible.
• Sales forecast - GM displays the highest forecasted growth in total annual sales according to CSM Worldwide, up 30 percent from 2009 levels to approximately 2.6 million units.
• Residual outlook – GM’s current 36-month residual performance is at 40.8 percent on average which is 4.9 percentage points higher than in 2009 (only January/February and March/April editions are included).
Ford
Ford successfully reduced incentives and fleet sales, leading to an improved residual outlook. The automaker also has the best reputation and perceived quality among the Detroit 3. Additionally, Ford performed well without any government bailout which has impacted consumer perception – Ford posted the strongest gains in ALG’s perceived quality score (PQS) in the Fall 2009 survey versus the Fall 2008 iteration.
• Sales forecast - Ford shows 11.6 percent year-over-year growth for 2010 from 2009 levels to approximately 1.7 million units.
• Residual outlook – Ford’s current 36-month outlook is at the top among the Detroit 3 OEMs with 41.5 percent, 2.8 percentage points higher than in 2009.
Chrysler
Even though Chrysler has managed to come out of bankruptcy quickly in 2009 with minimized impact on resale values, uncertainty about the product plan under the alliance Fiat still remains. This has also impacted the perception of the Chrysler brands while clearly slipping in ALG’s PQS by significant amounts relative to pre-bankruptcy perception.
• Sales forecast - Chrysler is relatively flat at <1 percent expected YOY growth from 2009 levels.
• Residual outlook – Chrysler’s current 36-month outlook has slipped to the bottom of the Detroit 3 at 39.2 percent, a gain of 1.3 percentage points over 2009.
Conclusion
2009 was one of the roughest roads the auto industry has traveled with significant difficulties for the Detroit 3. Yet the road ahead looks more promising for the Detroit 3 with on average a gain of approximately 3 percentage points in the 36-month residual outlook.
GM is projected to be the big gainer, coming from a low point. Because of uncertainty Chrysler remains rather flat in the sales outlook and gains little in ALG’s residual forecast falling back to third position. Ford is on track to further strengthen its leadership position among the three (followed closely by GM). ALG predicts an industry gain of approximately 2 percentage points in 36-month residuals over 2009.
More Fleet Acquisition
Global Carsharing Fleet Projected to Reach 768,000 Vehicles By 2030
A new Berg Insight forecast outlines several business models driving the projected growth in public carsharing worldwide through 2029.
Read More →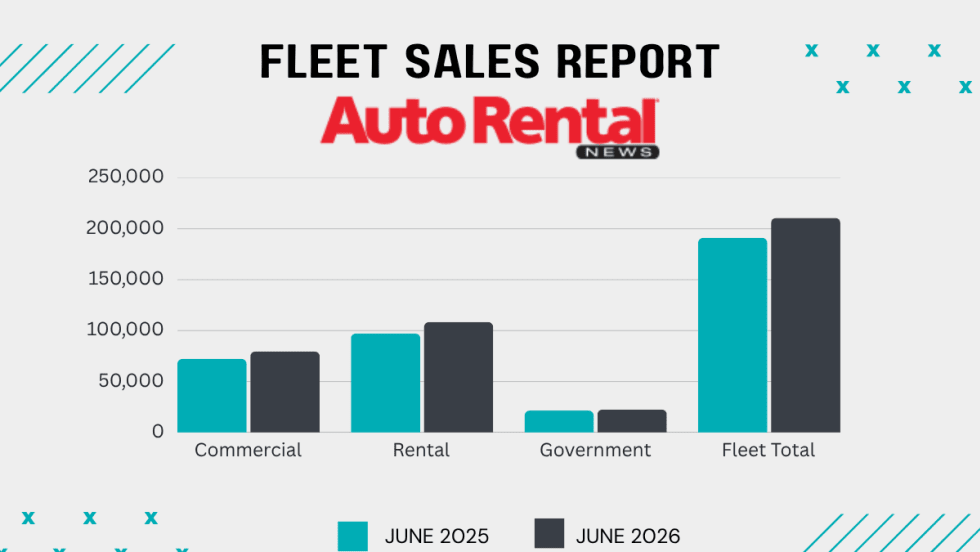
Rental Car Fleet Sales Show Mid-Year Strength
June gains ensured rental fleets closed out the first half of 2026 in positive territory.
Read More →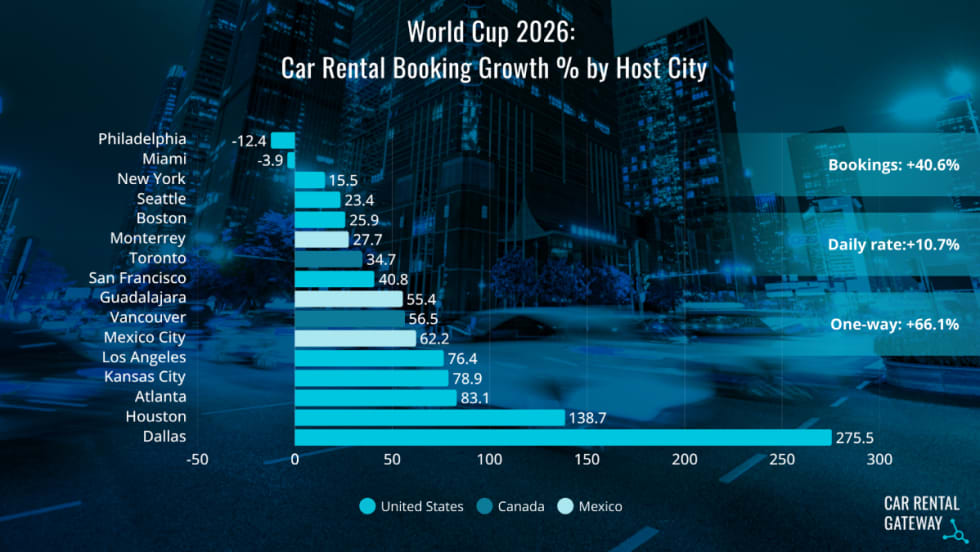
World Cup Travel Data Shows Longer Car Rentals and More One-Ways
A recent analysis of FIFA bookings found varied demand patterns that influenced rental car pricing.
Read More →
A Leveling Force: AI Morphs Into A Rental Car Profit-Seeker
Revenue managers can’t match the emerging AI tools gobbling lots of data that could counter the competitive race to the rate bottom.
Read More →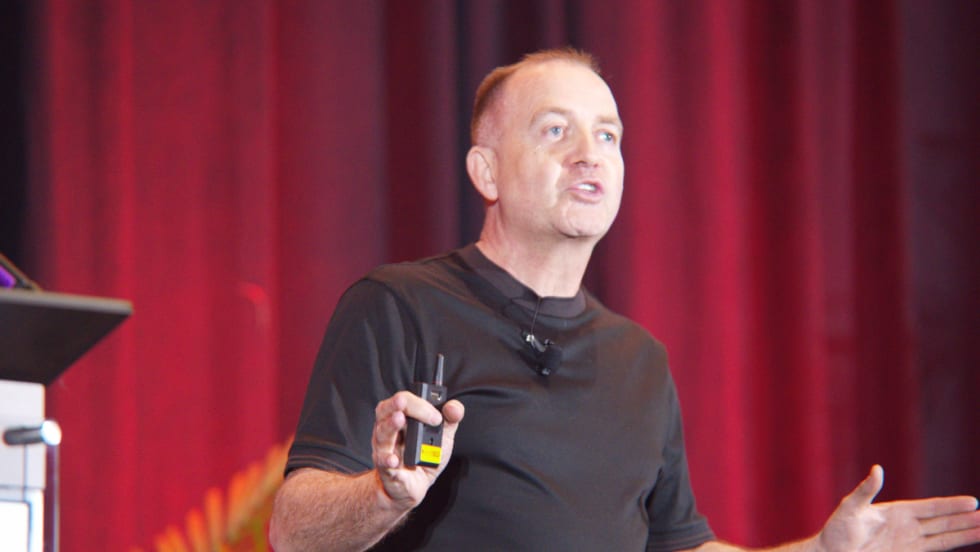
Rethink The Future To Avert A Race To The Bottom
Rental car operators heard a sobering industry message and a stern challenge at the close of the International Car Rental Show.
Read More →
DriveItAway, Free2move Plan Shared Fleet Program for Independent Rental Fleet Operators
Vehicles would be placed with participating rental operations to support car renter demand and provide additional fleet capacity.
Read More →
Stellantis Recalls 1.3 Million Jeep Vehicles Worldwide Over Fire Risk
Stellantis is recalling more than 1.3 million Jeep Wrangler and Gladiator models worldwide over a fire risk linked to power steering pump wiring.
Read More →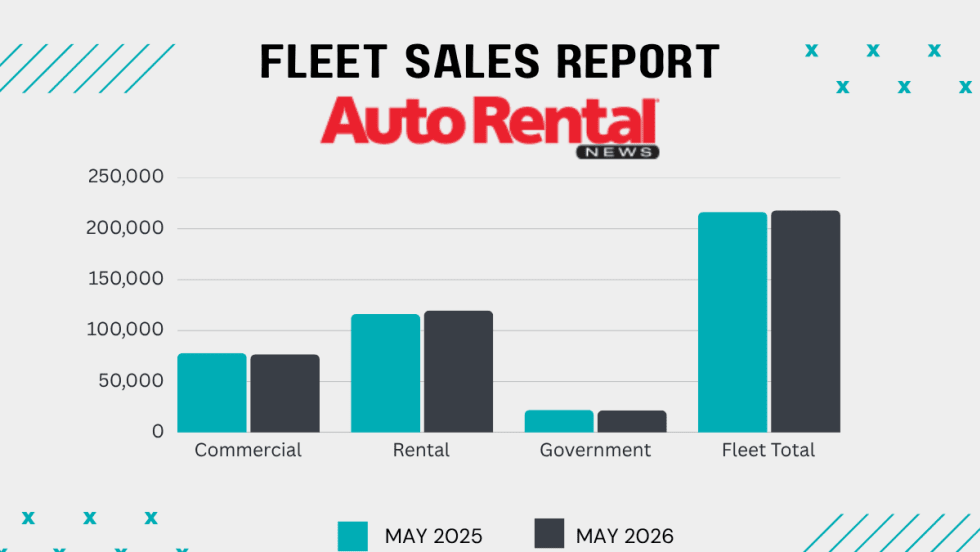
Rental Fleet Sales Skating Just Above 2025 Levels
The U.S. economy's continued growth and positive business investment are creating a favorable environment for fleet vehicle demand.
Read More →
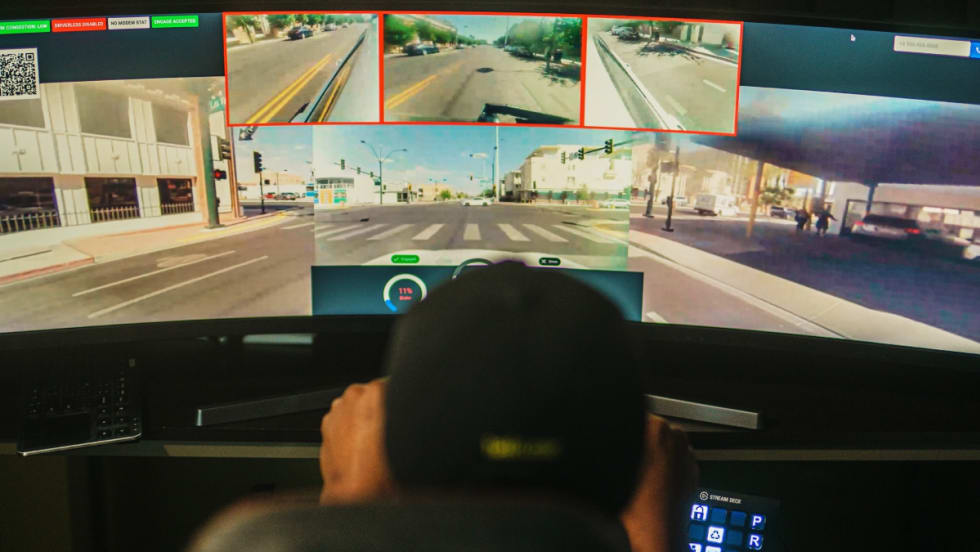
Get Ready To Roll: No Stopping Self-Driving Rental Cars
The autonomous mobility technology revolution will move at its own pace, but sooner rather than later.
Read More →
Cross-Pressures, Evolving Trends Drive 2026 Rental Car Industry
A combination of cautious economic behavior, shifts in the rental vehicle market, and technological influences are shaping car rental operator decisions.
Read More →