


Black Book: Market Continues Stable Value Trend
Ricky Beggs of Black Book provides an in-depth analysis of the wholesale market for the quarter and year to date.
Each month Ricky Beggs, vice president and managing editor of Black Book, the vehicle valuation guide, provides an analysis of trends in the used car market. This time around, he looks back further on the quarter and the year. It's a lot to digest, but great information for market watchers!
Whether you are a buyer or seller, franchised or independent, a financial institution or manufacturer, the interest in the past, current and future trends in the used market is on the top of the list of issues that affect your business and daily decisions. With only two months remaining in 2010, there are still plenty of opportunities within the used industry. With the overall trend in value retention in the past month representing a fall seasonal market, the question arises as whether this trend will continue or not and if so, at what point will we see a potential uptick in the market.
During the past month when looking at current three year old models, the majority, 15 of the 24 segment types tracked by Black Book, had depreciation levels for the month at or below the normal annual depreciation levels of 1.5 percent per month. This being a typical time when the market is slightly weaker in demand and value retention, the current trends are supported by a lower supply of vehicles in the marketplace than we are accustomed to. The average for all 24 segments for the past month was -1.47 percent or a monthly change of -$275.
When comparing the current trends of 2010 to those of a very strong 2009 market and a very volatile 2008, using respective three-year-old models, the trends for November 1st and the previous month resulted in -.51 percent (-$89) for 2009 and -3.22 percent (-$483) for calendar year November 2008.
Breaking the vehicles into a slightly different view, the trends by domestic cars, import cars, domestic trucks and import trucks, we see some very similar patterns for the past three years as we saw in the segment type comparisons. Domestic and import cars declined for the past month at -1.65 percent and -1.91 percent, respectively. In 2009 we actually reported an increase of .26 percent for domestic cars and a very solid -.42 percent for the import cars. For 2008 the changes were at -2.44 percent and -3.71 percent, respectively for domestic and import cars.
The truck trending is slightly better for 2010 at -1.03 percent for domestic trucks and a very similar -1.00 percent for the import trucks. I see this as an indication that the consumer in the United States still desires vehicles with carrying capabilities and versatile functionality.
One year ago for 2009, the domestic trucks were the weakest in retention for the month, but at a still respectable -1.07 percent. The import trucks declined only -.09 percent for the month. During 2008 the market was right in the middle of the gas price volatility and had retention value declining -2.69 percent and -2.57 percent for the domestic trucks and import trucks, respectively.
[PAGEBREAK]
The five most volatile segments in percentage change during the past month were the passenger minivans at -2.54 percent, followed by the premium sporty cars, luxury level cars, prestige luxury cars and gradually down to the entry mid-size cars at -2.02 percent for the month.
For the same period in 2009 the segments with the greatest decline were a completely different group of vehicles led by the cargo minivans at -2.95 percent followed by the mid-size SUVs, full-size vans and then the full-size SUVs at -1.57 percent.
During the ups and downs of the 2008 market, we had significantly higher depreciation levels for the month with cargo minivans at -7.63 percent followed by passenger minivans, compact SUVs, upper mid-size cars, and during the gas price declines, the entry level cars were getting back to a less than emotional purchase at -4.36 percent.
When looking at individual vehicle changes, the three year old vehicles had some pretty extreme adjustments during the last month. With the overall change of -1.4 percent for the last month, seeing monthly changes of -9.20 percent on the Town & Country, -7.11 percent on the M35, -5.88 percent on the MKX and -5.30 percent on the Forenza show volatility on a variety of makes and models. Not all significant changes were declines in value as the CX-9 increased 2.18 percent, the Ridgeline came in at +2.08 percent, the SRX increased 1.86 percent and the Sedona increased 1.72 percent. All of the stronger models fit in the utility or van categories.
Even in the overall strength in the market for October to November 2009, there were some individual vehicles with some greater than normal declines in value. With the Grand Caravan Cargo vans at -6.67 percent, the Vue at -5.68 percent, the GX470 at -5.70 percent, the XK at -4.36 percent and the Camry at -4.21 percent, both the utilities and cars were affected. 2009 also had some vehicles with positive movement with the Outback at +5.37 percent, the Mariner at +3.42 percent and the Acadia at +3.11 percent to name a few.
Because the second half of 2008 presented a very up and down market driven mostly by the climb and fall of the price of gasoline, we saw unprecedented levels of change on some individual vehicles. We tracked some vehicles that had monthly depreciation levels at some more normal annualized amounts. A few that stand out are the MPV at -13.08 percent, the Grand Caravan at -12.01 percent, and the Sportage at -11.86 percent and even the Saab 9-3 at -10.26 percent.
As gas prices declined during the fall of 2008 some vehicles that aren't perceived to have very good fuel economy levels were increasing in value for the month. The Range Rover HSE increased by 2.68 percent, the GX470 at +1.53 percent, the Tundra at +1.34 percent, the Escalade at .99 percent and the Titan increased by +.64 percent for the month.
Year over year trending also shows a pretty stable to strong performance in the market. This year nine of the 24 segment types have declined in value by 10 percent or less since Nov. 1, 2009. An interesting note is that all nine segments are utility, pickup or van type vehicles.
Within those segments that declined at or above the expected normal annual depreciation, the prestige luxury cars (-20 percent), the near luxury cars (-17 percent) and the luxury level cars (-17 percent) were not a surprise. The entry level cars (-17 percent) for now, was a little more interesting considering the current price of gas and the overall economic conditions and struggling consumer confidence. This is a segment that is on my watch list over the next few years for retention levels.
The bottom line is the market for this year and even compared to the previous two years is very stable in retention value for the last month, as well as year over year trending.
This is another reason that Black Book focuses on reporting the market as it occurs in the auction lanes and through the airwaves from a competitive bidding process. Trying to work off of traditional depreciation expectations just wouldn't provide timely market results, from an independent source, that is accurate for the dealers, financial institutions, manufacturers, fleets and government agencies.
More Fleet Acquisition

Global Carsharing Fleet Projected to Reach 768,000 Vehicles By 2030
A new Berg Insight forecast outlines several business models driving the projected growth in public carsharing worldwide through 2029.
Read More →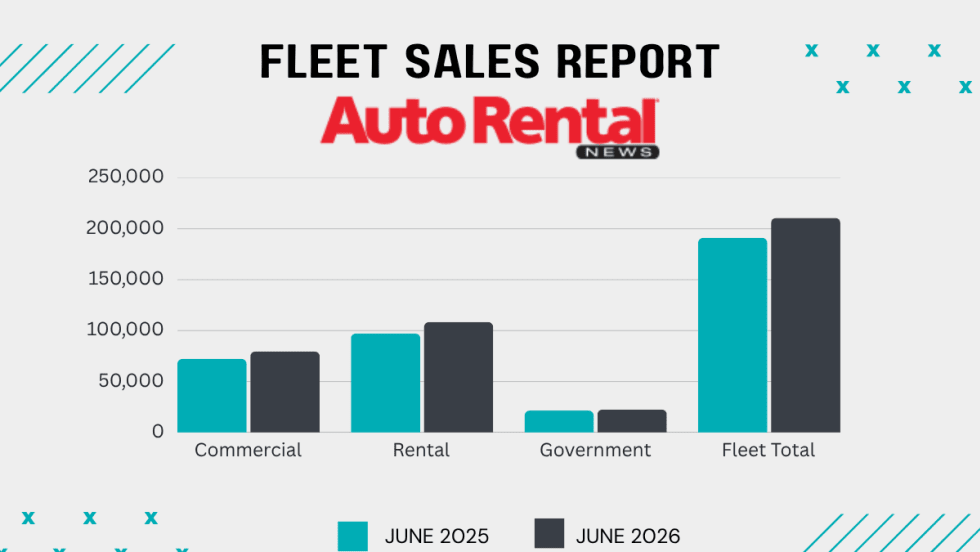
Rental Car Fleet Sales Show Mid-Year Strength
June gains ensured rental fleets closed out the first half of 2026 in positive territory.
Read More →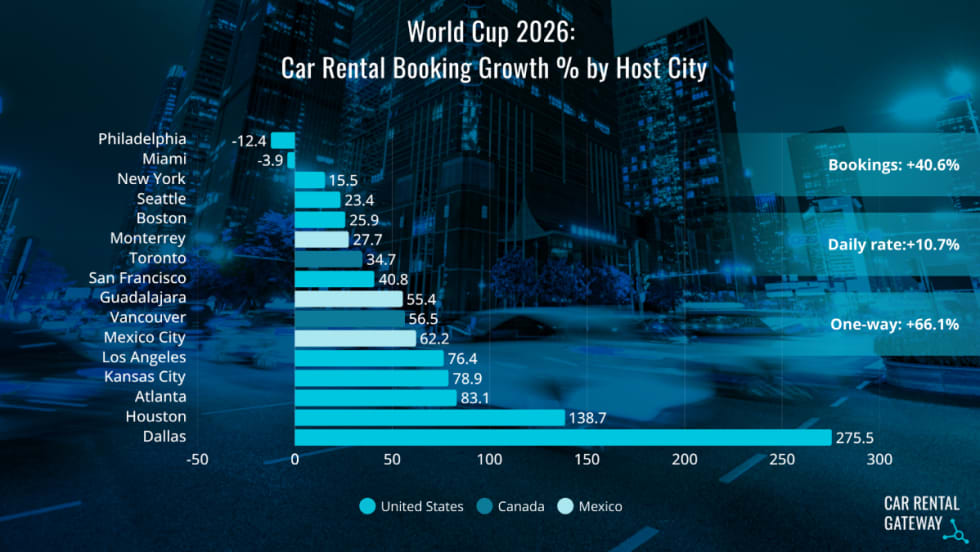
World Cup Travel Data Shows Longer Car Rentals and More One-Ways
A recent analysis of FIFA bookings found varied demand patterns that influenced rental car pricing.
Read More →
A Leveling Force: AI Morphs Into A Rental Car Profit-Seeker
Revenue managers can’t match the emerging AI tools gobbling lots of data that could counter the competitive race to the rate bottom.
Read More →
Rethink The Future To Avert A Race To The Bottom
Rental car operators heard a sobering industry message and a stern challenge at the close of the International Car Rental Show.
Read More →
DriveItAway, Free2move Plan Shared Fleet Program for Independent Rental Fleet Operators
Vehicles would be placed with participating rental operations to support car renter demand and provide additional fleet capacity.
Read More →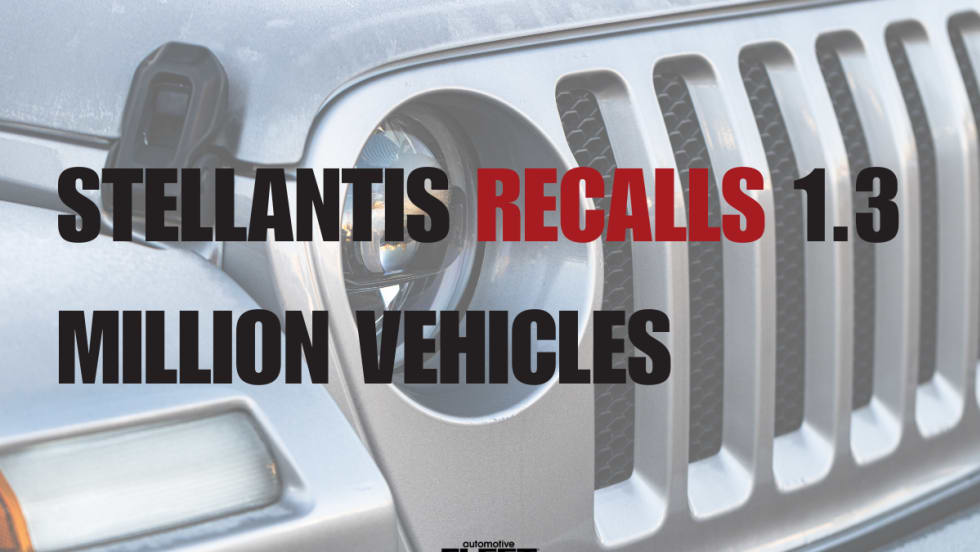
Stellantis Recalls 1.3 Million Jeep Vehicles Worldwide Over Fire Risk
Stellantis is recalling more than 1.3 million Jeep Wrangler and Gladiator models worldwide over a fire risk linked to power steering pump wiring.
Read More →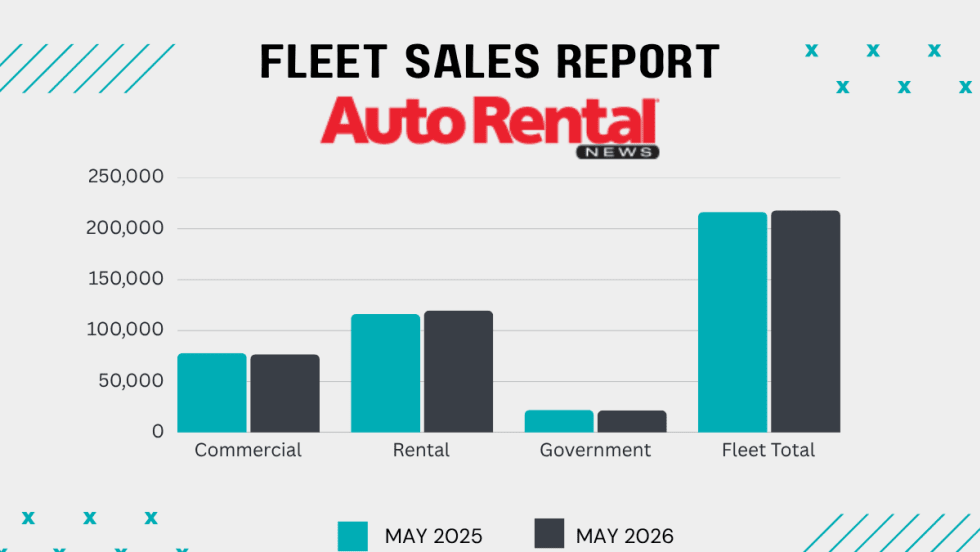
Rental Fleet Sales Skating Just Above 2025 Levels
The U.S. economy's continued growth and positive business investment are creating a favorable environment for fleet vehicle demand.
Read More →
Get Ready To Roll: No Stopping Self-Driving Rental Cars
The autonomous mobility technology revolution will move at its own pace, but sooner rather than later.
Read More →
Cross-Pressures, Evolving Trends Drive 2026 Rental Car Industry
A combination of cautious economic behavior, shifts in the rental vehicle market, and technological influences are shaping car rental operator decisions.
Read More →