

Six-City Survey: December Rates Up $4.83 over Dec 2012
In addition to a $4.83 increase in rates from December 2013 to December 2012, Rate-Highway’s recent monthly rate survey also presented inconsistent rates among the individual cities — Houston was up $26.78 while Chicago was down $26.38.
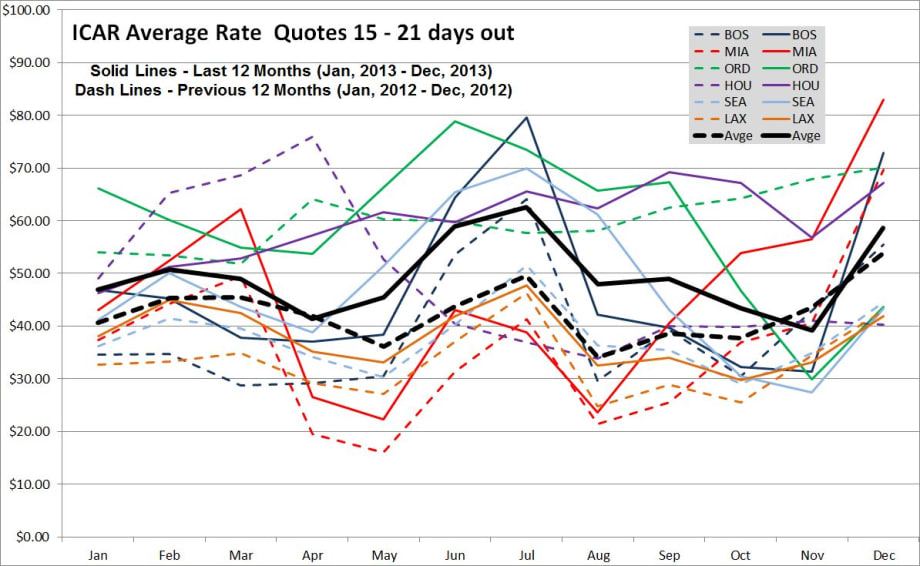
Rate data provided by Rate-Highway, a leading provider of revenue management services for the auto rental industry. Rates are an average of aggregator/OTA rates for all vendors present in the markets listed on the date of the survey. These tables and graph show the average of all base rate quotes per day for an ICAR at the six airports shown, for arrivals 15 to 21 days ahead of the date of the survey, for two- and seven-day rentals.
With the help of Jim Tennant of The Tennant Group and Michael Meyer of Rate-Highway Inc., we are conducting rate surveys on a weekly basis and providing analysis and comments where appropriate. We publish this monthly recap in our electronic edition and more comprehensive looks in the print editions.
ICAR Average Rate Quotes - Monthly Averages
Apr-12 | May-12 | Jun-12 | Jul-12 | Aug-12 | Sep-12 | Oct-12 | Nov-12 | Dec-12 | |
|---|---|---|---|---|---|---|---|---|---|
29.22 | 30.47 | 53.51 | 64.05 | 29.58 | 39.25 | 30.53 | 42.94 | 55.52 | BOS |
19.48 | 16.04 | 31.34 | 41.24 | 21.46 | 25.50 | 36.89 | 40.57 | 69.60 | MIA |
64.10 | 60.23 | 59.81 | 57.60 | 58.06 | 62.46 | 64.17 | 67.84 | 70.08 | ORD |
75.86 | 52.69 | 40.42 | 36.89 | 33.86 | 39.99 | 39.80 | 41.00 | 40.31 | HOU |
34.14 | 30.37 | 40.33 | 51.55 | 36.26 | 35.41 | 29.00 | 34.89 | 44.57 | SEA |
29.17 | 27.12 | 36.99 | 46.23 | 24.76 | 28.81 | 25.55 | 34.44 | 42.88 | LAX |
41.99 | 36.16 | 43.73 | 49.59 | 34.00 | 38.57 | 37.66 | 43.61 | 53.83 | Avge |
Apr-13 | May-13 | Jun-13 | Jul-13 | Aug-13 | Sep-13 | Oct-13 | Nov-13 | Dec-13 | |
37.06 | 38.30 | 64.36 | 79.53 | 42.20 | 39.73 | 32.21 | 31.40 | 72.92 | BOS |
26.49 | 22.29 | 43.08 | 38.80 | 23.62 | 40.62 | 53.89 | 56.54 | 82.92 | MIA |
53.75 | 66.26 | 78.85 | 73.41 | 65.77 | 67.26 | 46.75 | 29.95 | 43.70 | ORD |
57.26 | 61.59 | 59.74 | 65.59 | 62.26 | 69.25 | 67.19 | 56.85 | 67.09 | HOU |
38.84 | 51.36 | 65.42 | 69.90 | 61.19 | 43.07 | 30.50 | 27.47 | 43.39 | SEA |
35.08 | 33.10 | 41.90 | 47.68 | 32.57 | 34.01 | 29.78 | 33.16 | 41.92 | LAX |
41.42 | 45.48 | 58.89 | 62.48 | 47.93 | 48.99 | 43.39 | 39.23 | 58.65 | Avge |
Year to Year Comparison
Apr | May | Jun | Jul | Aug | Sep | Oct | Nov | Dec | |
7.84 | 7.83 | 10.86 | 15.47 | 12.62 | 0.49 | 1.68 | (11.54) | 17.40 | BOS |
7.02 | 6.25 | 11.74 | (2.44) | 2.16 | 15.12 | 17.00 | 15.97 | 13.31 | MIA |
(10.34) | 6.03 | 19.04 | 15.81 | 7.70 | 4.80 | (17.43) | (37.90) | (26.38) | ORD |
(18.60) | 8.90 | 19.31 | 28.70 | 28.40 | 29.26 | 27.39 | 15.85 | 26.78 | HOU |
4.70 | 20.98 | 25.09 | 18.35 | 24.92 | 7.66 | 1.51 | (7.42) | (1.18) | SEA |
5.91 | 5.97 | 4.92 | 1.45 | 7.81 | 5.21 | 4.23 | (1.28) | (0.97) | LAX |
(0.58) | 9.33 | 15.16 | 12.89 | 13.94 | 10.42 | 5.73 | (4.39) | 4.83 | Avge |
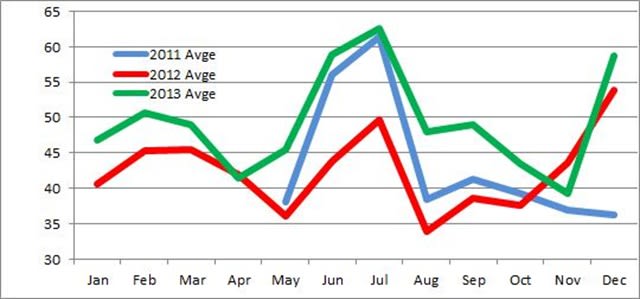
Last month, we observed that 12 months of year-over-year rate quote increases came to an end, with November 2013 $4.39 lower than the same month in 2012. As demonstrated in the graph below and tables above, December 2013 rebounded — up $4.83 over December 2012.
Individual cities were very inconsistent. Houston was up $26.78 in December and Chicago was down a similar amount at $26.38. But Boston and Miami were up substantially while Seattle and Los Angeles were down marginally. Therefore, the six-city average of a $4.38 increase did not illustrate a good picture of any one city or the overall industry.
It appears that local situations such as weather and abnormal demand or supply were more significant than overall industry trends. Statisticians sometimes talk of a man drowning in a river that averages 6 inches deep. This month seems to fit that analogy.
Over the last year, individual cities — with exception of Chicago — were quite consistent. All five airport rates were up for the calendar year 2013. It should be noted that Chicago had a very large run-up in 2012 and fell back slightly in 2013, but still had a healthy average quote of $58.90.
2012 | 2013 | Yr over Yr | |
|---|---|---|---|
BOS | 39.42 | 47.30 | 7.88 |
MIA | 36.09 | 45.49 | 9.40 |
ORD | 60.29 | 58.90 | (1.39) |
HOU | 48.64 | 59.76 | 11.12 |
SEA | 37.80 | 47.16 | 9.36 |
LAX | 33.06 | 37.89 | 4.83 |
Avge | 42.55 | 49.42 | 6.87 |
We are gathering rate quotes for the top 50 U.S. airports and are planning to replace the six-city sample with the larger one in June 2014 — when we will have 13 months, allowing us to do a year-over-year comparison. The larger sample should reduce or eliminate the effect of a major event in one city on the overall average.
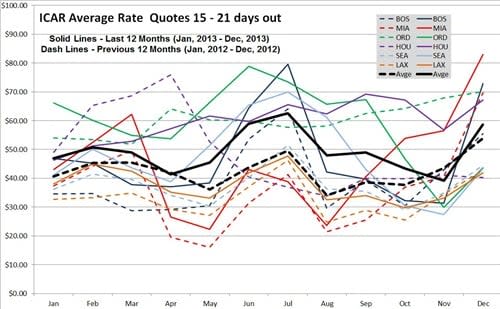
Rate data provided by Rate-Highway, a leading provider of revenue management services for the auto rental industry. Rates are an average of aggregator/OTA rates for all vendors present in the markets listed on the date of the survey. These tables and graph show the average of all base rate quotes per day for an ICAR at the six airports shown, for arrivals 15 to 21 days ahead of the date of the survey, for two- and seven-day rentals.
More Rental Operations

Stop Losing Money On Rental Tolls
Regardless of your rental fleet size and structure, fleet managers, executives, and owners can gain valuable insights into an often-overlooked area of fleet operations.
Read More →
Rethink The Future To Avert A Race To The Bottom
Rental car operators heard a sobering industry message and a stern challenge at the close of the International Car Rental Show.
Read More →
DriveItAway, Free2move Plan Shared Fleet Program for Independent Rental Fleet Operators
Vehicles would be placed with participating rental operations to support car renter demand and provide additional fleet capacity.
Read More →
Stellantis Recalls 1.3 Million Jeep Vehicles Worldwide Over Fire Risk
Stellantis is recalling more than 1.3 million Jeep Wrangler and Gladiator models worldwide over a fire risk linked to power steering pump wiring.
Read More →
Green Motion And U-Save Open Rental Operations In Guatemala
The brands will open their first rental car outlets in the country at La Aurora International Airport in Guatemala City.
Read More →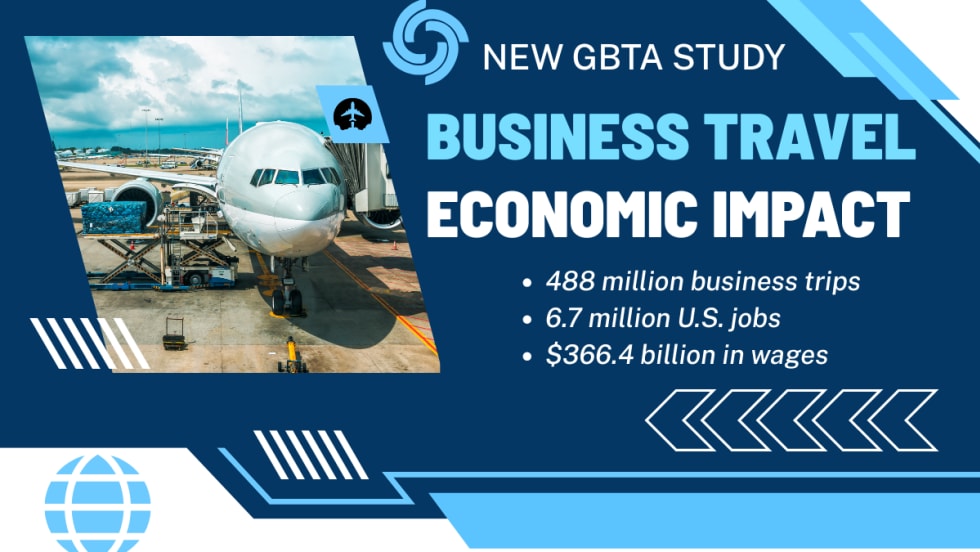
U.S. Business Travel Drives $623 Billion+ in Economic Impact as Spending Reaches $538 Billion
The data also underscores the industry’s strong multiplier effect across the U.S. economy, revealing that each dollar invested in business travel in 2024 generated $1.16 in GDP.
Read More →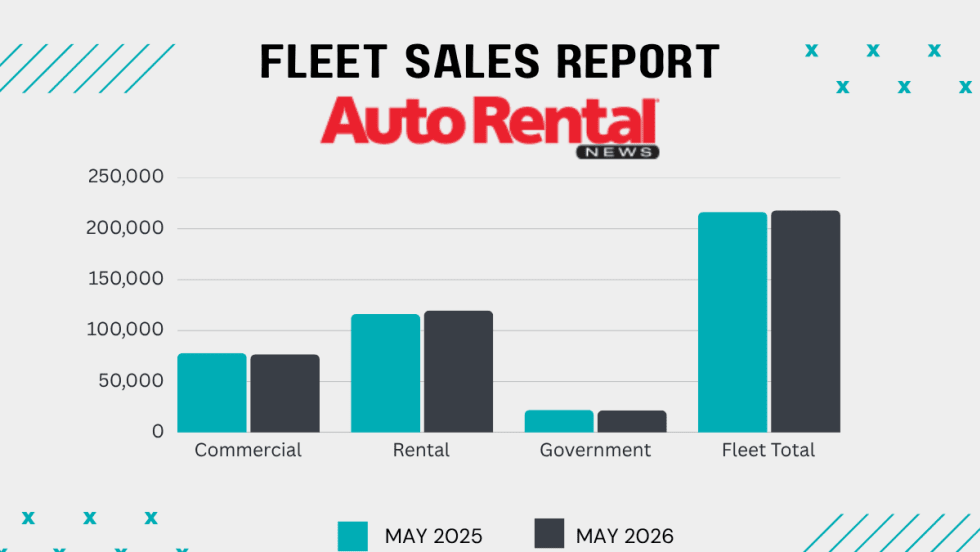
Rental Fleet Sales Skating Just Above 2025 Levels
The U.S. economy's continued growth and positive business investment are creating a favorable environment for fleet vehicle demand.
Read More →
Grow Your Rental Business Beyond Cars
Rental fleet operations are facing numerous evolving challenges and opportunities from AI technology to rate and revenue management, to customer service and business growth.
Read More →
Using AI to Create Clarity, Not Conflict, in Rental Car Damage
Rental companies still need people, policy, judgment, and thoughtful implementation, with operators remaining in control of the customer experience.
Read More →
Get Ready To Roll: No Stopping Self-Driving Rental Cars
The autonomous mobility technology revolution will move at its own pace, but sooner rather than later.
Read More →