


Related: Europcar's Mobility Lab Joins Smart Cities Platform
Europcar Ends 2018 with 2.9M Euros in Revenue
The number of rental days reached a new record of 87.7 million in 2018, up 27% versus 2017.
February 21, 2019

In 2018, the Group posted a net profit of 139 million euros ($157 million), up 128% compared to last year’s net profit of 61 million euros ($69 million) in 2017.
Photo courtesy of Europcar.
2 min to read
In 2018, Europcar Mobility Group generated revenues of 2.9 million euros ($3.2 million) up 22% at constant exchange rates compared with 2017. On a pro-forma basis, i.e. at constant exchange rates and including the 2017 performance of Goldcar, Europcar Denmark, and Buchbinder, the Group revenues grew by 3.4%.
This significant increase in Group revenues was the result of positive growth across all the Group’s key markets and in all of its three major business units with cars growing by 9.4%, vans & trucks growing by 29%, and low cost growing by 200%. On a pro-forma basis, these three major business units grew their revenues by respectively 2.2%, 8.4% and 2.9%.
The number of rental days reached a new record of 87.7 million in 2018, up 27% versus 2017. On a pro-forma basis, growth in rental days was 3.4% for the Group spread across all its key business units.
Net income
In 2018, the Group posted a net profit of 139 million euros ($157 million), up 128% compared to last year’s net profit of 61 million euros ($69 million) in 2017. This is mostly due to the impact of the Group’s strong increase in adjusted Corporate EBITDA over the period as well as the one off gain generated from the sale of the company’s stake in car2go.
Operational Highlights
Following the Group’s investment into the low cost segment, 60% of the Group’s rental revenue in 2018 was generated in the leisure segment, versus 56% in 2017, which acted as the main engine of growth during the period, with the Group’s corporate business being responsible for the remaining 40%.
In 2018, the Group has made significant progress on two of its key operating metrics: fleet utilization and fleet cost per unit. The Group delivered a solid performance in terms of fleet financial utilization with an increase in its BU cars but a decrease in its BU vans & trucks due to the integration of Buchbinder. Overall, at the Group level, financial fleet utilization reached 76.1% in 2018 and decreased by 30 basis points versus 2017 but actually increased by 10 basis points on a proforma basis i.e. without the negative impact of Buchbinder.
The Group reduced its fleet cost per unit per month significantly from 243 euros ($275) in 2017 to 226 euros ($256) in 2018 thanks to a better damage recovery ratio and lower reconditioning costs across the Group, coupled with a positive impact from recent acquisitions in terms of fleet mix, evolving towards lower car categories.
More Rental Operations

The Desk Upsell Is Costing Operators More Than it Earns
Counter upsells generate revenue, but they can also slow transactions, erode trust, and cost repeat business. Fully inclusive pricing may offer operators a better path to long-term value.
Read More →
U-Save Expands Indian Ocean Presence with New Master Franchise for Mauritius
The franchise has been acquired by Mauritian travel entrepreneur Umarfarooq Omarjee, an established figure in the island's tourism and mobility sector.
Read More →
Global Carsharing Fleet Projected to Reach 768,000 Vehicles By 2030
A new Berg Insight forecast outlines several business models driving the projected growth in public carsharing worldwide through 2029.
Read More →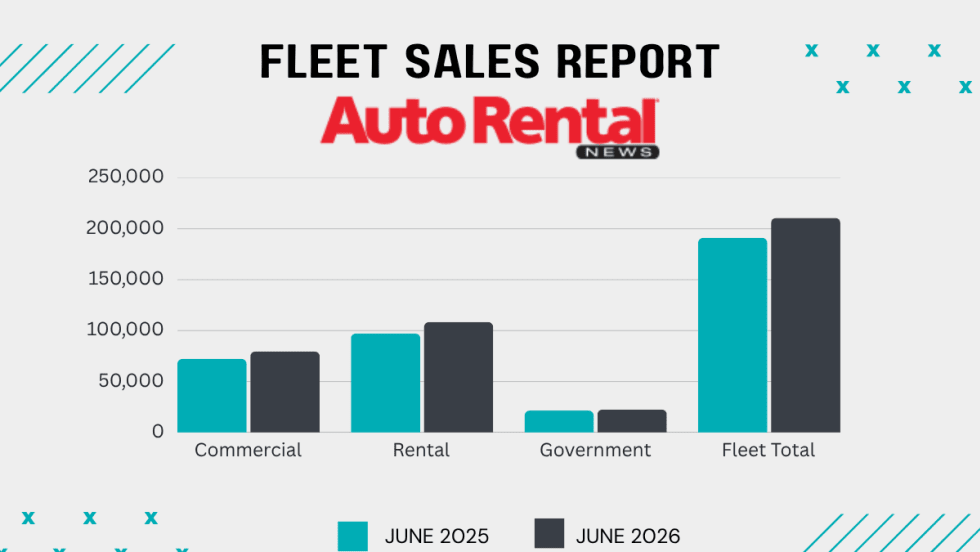
Rental Car Fleet Sales Show Mid-Year Strength
June gains ensured rental fleets closed out the first half of 2026 in positive territory.
Read More →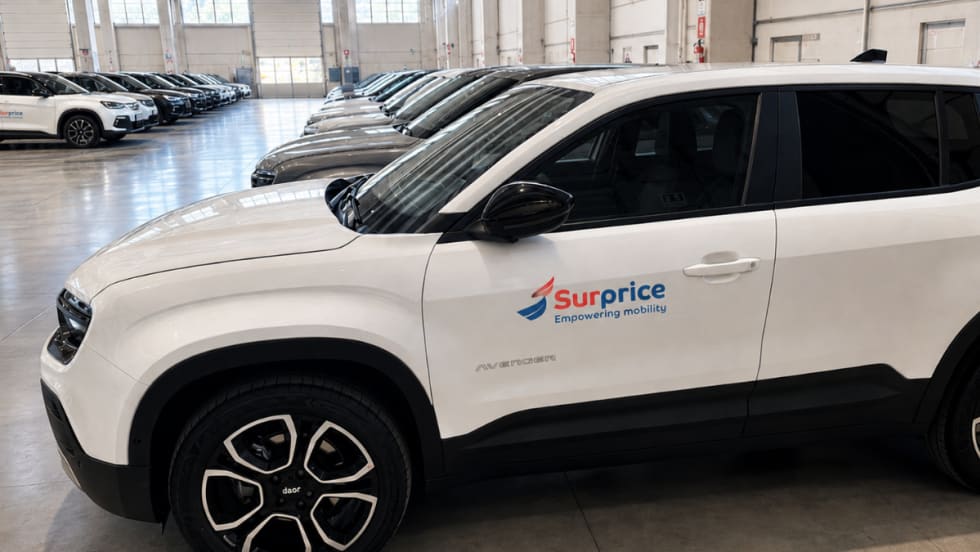
Surprice Mobility Opens Corporate Rental Station at Milan Malpensa Airport
The Milan opening is part of Surprice Mobility's broader strategy to expand its corporate operations while increasing the use of technology across its network.
Read More →
Brazilian Executive MBA Targets Growing Domestic Rental Car Industry
Rental car companies face a unique combination of challenges that are rarely addressed in traditional programs.
Read More →
Green Motion Expands Into Japan With Master Franchise Agreement
Japan's tourism industry, business travel market, and demand for vehicle rental services are reasons the country represents an important market for the company.
Read More →
ACRA Carrying Fuller Industry Load As AI and EVs Lurk In Future
The leading car rental professional business group details an active legislative, regulatory, and macro-trends agenda affecting car rental operators.
Read More →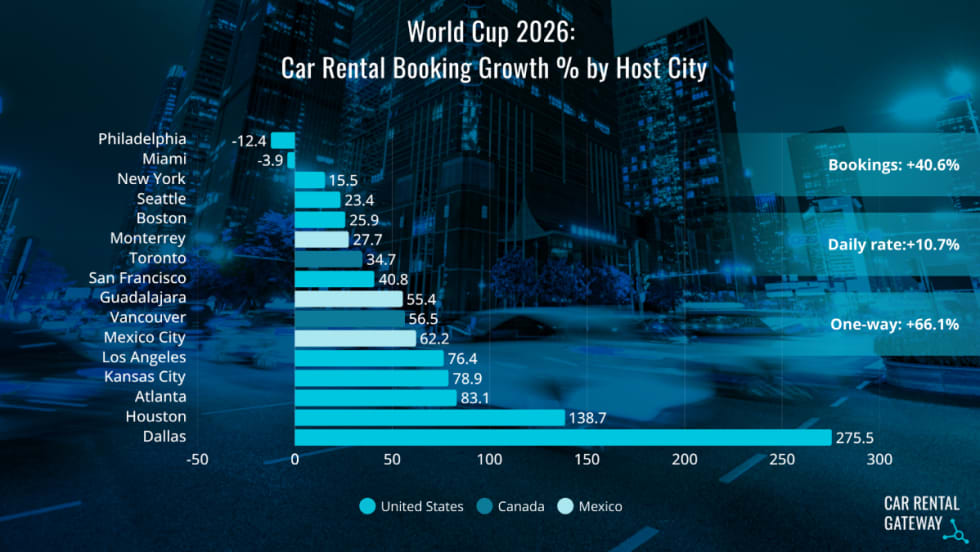
World Cup Travel Data Shows Longer Car Rentals and More One-Ways
A recent analysis of FIFA bookings found varied demand patterns that influenced rental car pricing.
Read More →
A Leveling Force: AI Morphs Into A Rental Car Profit-Seeker
Revenue managers can’t match the emerging AI tools gobbling lots of data that could counter the competitive race to the rate bottom.
Read More →