


Background Article: Near-Term Vehicle Market Trends
New Vehicle Prices Rise Agan, While Affordability Dips
The share of new-vehicle sales from luxury brands drove up average transaction prices, when combined with fewer discounts and incentives, caused new vehicle affordability to fall.
May 16, 2024
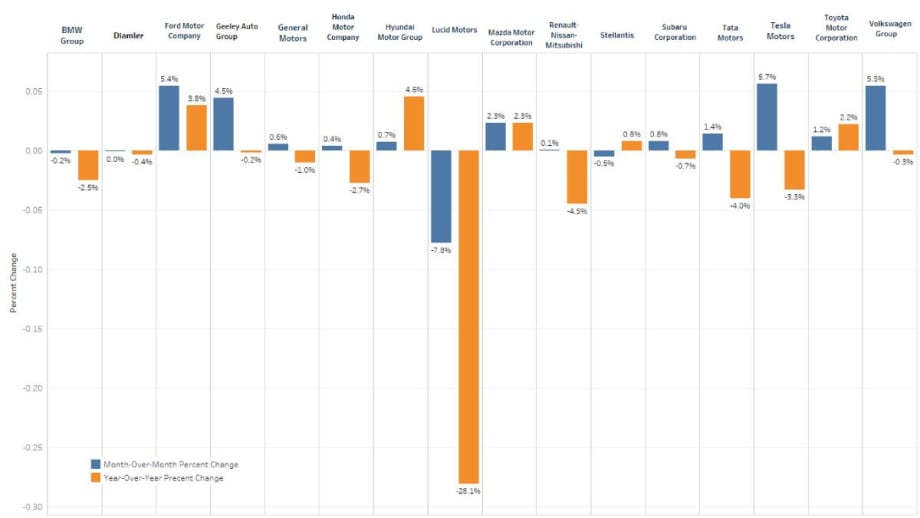
Month over month price changes pulled up for most automakers, while declines still dominate year over year comparisons.
Graphic: Cox Automotive
5 min to read
A downward slide in new-vehicle prices through the first quarter of 2024 reversed course in April, with average transaction prices (ATPs) increasing by 2.2% to $48,510, the highest prices since December 2023, according to price estimates released May 14 by Kelley Blue Book. Year over year, new-vehicle transaction prices were lower by 0.5%.
New-vehicle incentive levels retreated last month as well. The average incentive package in April was 6.3% of the average transaction price, according to Kelley Blue Book estimates, down from 6.6% in the prior month. The incentive decline in April was the first decrease since October 2023, when incentive levels ticked lower to 4.7% from 4.8% in September.
Driven partly by fewer selling days, new-vehicle sales volume in April was lower month over month. At 15.7 million in April, the seasonally adjusted annual rate (SAAR) of sales, however, was marginally higher versus March and flat year over year. New-vehicle inventory levels – a key driver of price and incentives – at the start of April were estimated by vAuto to be higher year over year by 46%.
Inventory, however, was mostly unchanged month over month, suggesting the rapid increase in available supply has slowed. The increase in available inventory has kept downward pressure on prices and is one reason average transaction prices in April were lower year over year.
“The month-over-month increase in pricing in April is likely just a reflection of some pullback on incentives compared to the end of Q1, in March, when many automakers were pushing discounts to hit a strong finish to the quarter,” sai Erin Keating, executive analyst at Cox Automotive. “Still, prices are down year over year. Affordability challenges continue to lurk, and as inventory slowly builds, we can expect to see incentives slowly grow through the remainder of 2024 to help keep any sales momentum alive.”
Luxury Vehicle Share and Prices Push Overall ATP Higher
The share of new-vehicle sales from luxury brands in April was 18.4%, according to the Kelley Blue Book analysis, equal to the share in March and higher than the 18.2% in April 2023. Luxury transaction prices increased 2.4% from the prior month and incentives were notably lower, at 6% of ATP, down from 7.4% of ATP in March.
Tesla, the luxury market leader, posted larger-than-average ATP increases month over month in April, with a gain of 5.7% compared to March. Volvo also posted higher-than-average ATP increases last month. All other luxury makes posted month-over-month gains less than the luxury vehicle average gain of 2.4%.
Still, luxury brand prices in April were lower by 2.1% year over year, indicating that price pressure remains front and center. In April 2023, the average price paid for a new luxury vehicle was a revised $65,418. Last month, luxury ATPs were $64,076. Luxury brand incentive levels were higher year over year by 86%, rising from 3.6% of ATP in April 2023 to 6.0% last month.
Non-Luxury Vehicles Prices Jump in April But Remain Lower Year Over Year
After declining month over month in January, February and March, non-luxury vehicle prices reversed course and increased in April, rising to $44,989 from a revised $44,078 in March. Prices of non-luxury vehicles were higher month over month in April by 2.1% and were mostly flat year over year, down by only 0.2%.
Higher prices for pickup trucks helped push non-luxury vehicle prices higher. The average transaction price for a full-size pickup truck in April, at $66,631, was higher year over year by 2.8%. The small and mid-size pickup segment, which includes the popular new Toyota Tacoma, posted a month-over-month price increase of 3.3%. Average transaction price: just shy of $43,000. Unlike the broader market, pickup truck prices in April were also higher year over year.
In April, incentives for non-luxury brands were flat compared to March, holding steady at 6.4% of ATP. Incentives in April were higher year over year by 85%.
Tesla Prices Increase for Second Consecutive Month
Tesla prices, which plummeted from $62,269 in January 2023 to $50,099 in December 2023, a decline of 19.5%, have been a key driver of volatile price dynamics in both the luxury market and the electric vehicle market – Tesla is the highest volume seller in both segments, No. 1 in luxury and No. 1 in EVs.
Electric vehicle transaction prices in April were essentially flat versus March – up about 0.1% – at $55,252, an increase of only $75 from the prior month. Year over year, the average transaction price for an EV was down 8.5%, thanks in part to price pressure on EVs driven by slowing sales, healthy inventory, and more competition. Electric vehicle incentive packages remain well above the industry average, in many cases more than 15-to-20% of ATP.
While some high-profile and popular EVs posted significant year-over-year price reductions in April – the Ford Lightning, transaction prices down 23%; the Ford Mustang Mach-e, down 15%; the Tesla Model Y, down 12%; and the Hyundai Ioniq 6, down 10% – most EVs today are transacting for prices lower than one year ago by about 4-to-5%.
New Vehicle Affordability Declines
As a result of the latest data trends, new-vehicle affordability declined in April, reversing some of the improvement in March, according to the Cox Automotive/Moody’s Analytics Vehicle Affordability Index.
“The decline in affordability resulted from negative trends in pricing and incentives, as manufacturers and dealers were less aggressive on promotions and discounting than they were for the quarter end,” said Cox Automotive chief economist Jonathan Smoke in a news release.
The estimated average auto loan rate improved in April by 24 basis points to 10.22%, the lowest rate in nine months. That rate decline did not offset the 2.2% increase in the average transaction price paid or the decline in incentives. Income growth continued as well.
Originally posted on Automotive Fleet
More Fleet Acquisition

Rethink The Future To Avert A Race To The Bottom
Rental car operators heard a sobering industry message and a stern challenge at the close of the International Car Rental Show.
Read More →
DriveItAway, Free2move Plan Shared Fleet Program for Independent Rental Fleet Operators
Vehicles would be placed with participating rental operations to support car renter demand and provide additional fleet capacity.
Read More →
Stellantis Recalls 1.3 Million Jeep Vehicles Worldwide Over Fire Risk
Stellantis is recalling more than 1.3 million Jeep Wrangler and Gladiator models worldwide over a fire risk linked to power steering pump wiring.
Read More →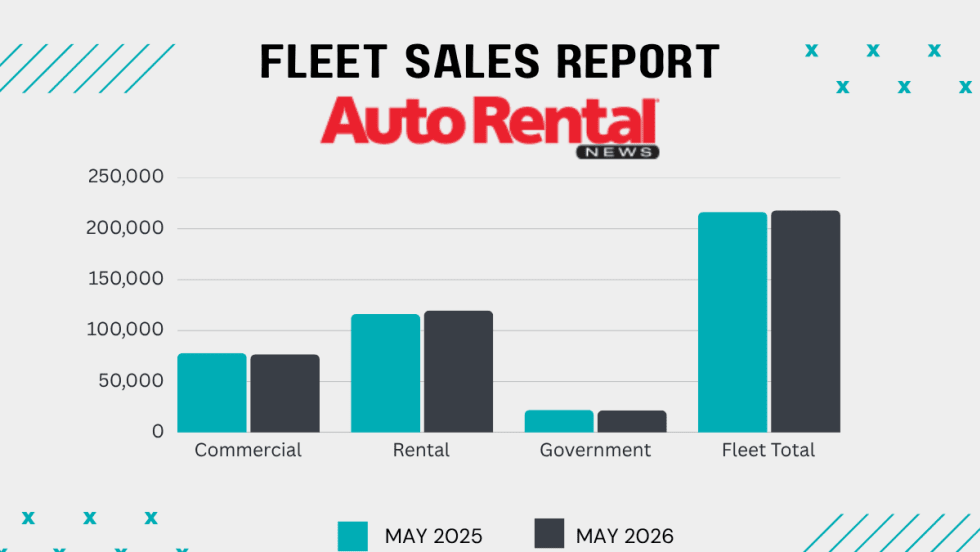
Rental Fleet Sales Skating Just Above 2025 Levels
The U.S. economy's continued growth and positive business investment are creating a favorable environment for fleet vehicle demand.
Read More →
Get Ready To Roll: No Stopping Self-Driving Rental Cars
The autonomous mobility technology revolution will move at its own pace, but sooner rather than later.
Read More →
Cross-Pressures, Evolving Trends Drive 2026 Rental Car Industry
A combination of cautious economic behavior, shifts in the rental vehicle market, and technological influences are shaping car rental operator decisions.
Read More →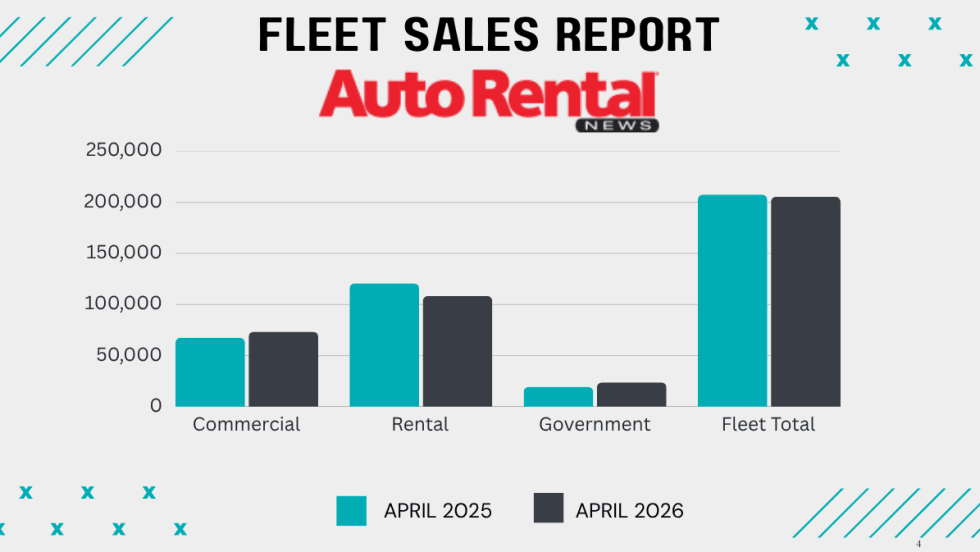
Monthly Rental Fleet Sales Dip Again As YTD Numbers Flatten
Pull-ahead demand for rental cars in the second half of 2025 appears to be slowing purchases so far this year.
Read More →
DriveItAway Transitions To OTCID, Expands To 40 U.S. Markets
The dual milestone propels the company toward its goals of accessing longer-term capital markets and deploying a national platform.
Read More →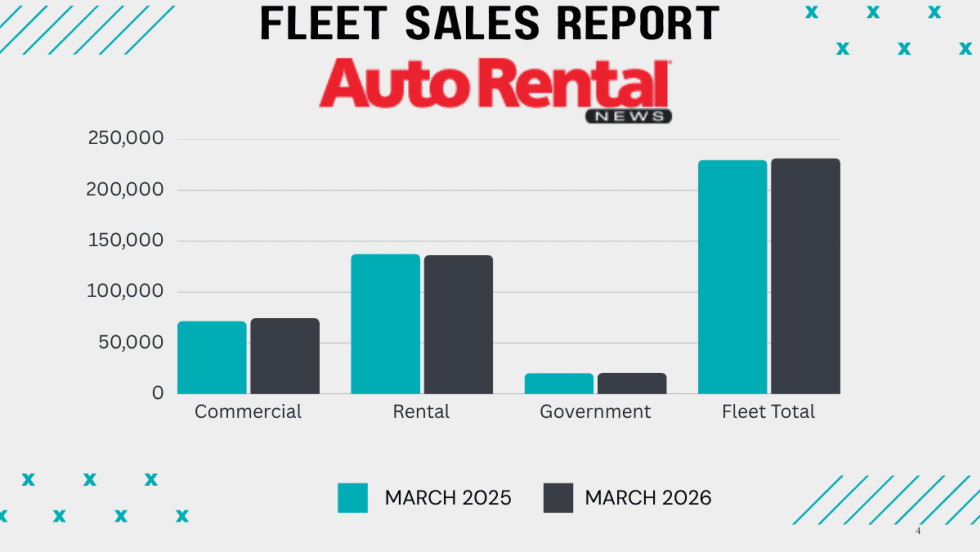
Rental Fleet Sales Stay Ahead In Q1 Despite Monthly Dip
Vehicle sales into commercial fleets are outpacing rental car fleet purchases so far this year.
Read More →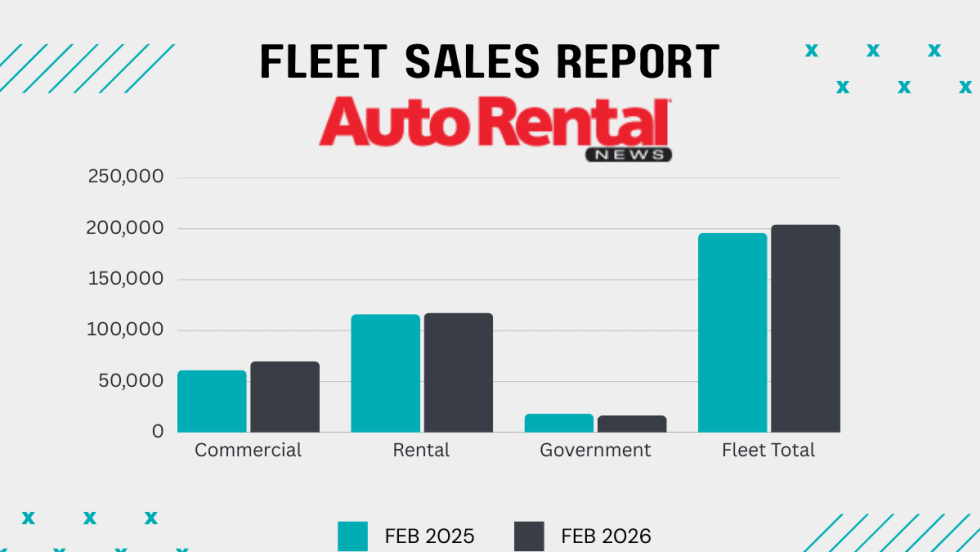
Rental Fleet Sales Slow In February Ending A Strong Streak
Commercial fleets posted the most gains, sustaining increases in monthly and year-to-date fleet sales
Read More →