

50-City Survey: June Airport Rates Flat, Differ by Region
In our inaugural 50-city survey, rate quotes for the top 50 U.S. airports remained flat in a year-over-year comparison. However, there were large differences in regional rates.
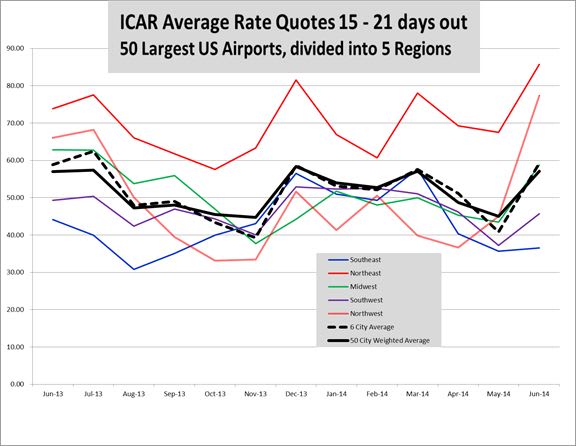
Rate data provided by Rate-Highway, a leading provider of revenue management services for the auto rental industry. Rates are an average of aggregator/OTA rates for all vendors present in the markets listed on the date of the survey. These tables and graph show the average of all base rate quotes per day for an ICAR at the six or 50 airports shown, for arrivals 15 to 21 days ahead of the date of the survey, for two- and seven-day rentals.
With a $0.14 increase in June 2014 over 2013, rate quotes for the top 50 U.S. airports remained flat in this year-over-year comparison, according to Rate-Highway’s monthly rate survey. However, there were large differences in regional rates. The Northwest had an increase of 11.35 year-over-year while the Southwest had a decrease of 3.67.
With the help of Jim Tennant of The Tennant Group and Michael Meyer of Rate-Highway Inc., we are conducting rate surveys on a weekly basis and providing analysis and comments where appropriate. We publish this monthly recap in our electronic edition and more comprehensive looks in the print editions.
For the first time, we have a year-to-year comparison of the ICAR rate quotes for the top 50 U.S. airports. We began gathering rate quotes in mid-May 2013, so June 2014 vs. June 2013 is the first full month with a year-to-year comparison.
With the expanded survey, it is possible to look at regional as well as national rate trends. We have divided the country into five regions, attempting to group airports into similar markets. This process will never be perfect, but we believe it is a useful way to look at rates.
The regions are defined as follows:
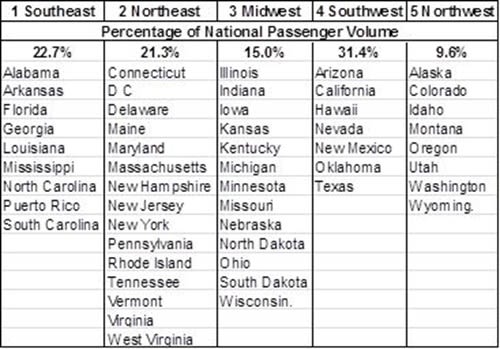
When doing the six-city surveys, we calculated the nationwide rate quote by averaging the six cities’ quotes. However, the largest of the 50 airports has 14 times more passenger volume than the smallest — a much larger swing than within the six cities. Therefore, we are weighting the 50 rate quotes by each city’s passenger volume when calculating the regional and national averages.
Year-to-Year Comparison for June

The new 50-city survey shows a $0.14 increase in June 2014 over 2013, essentially flat. We had seen year-over-year increases in the six-city quotes in 17 of the last 19 months. May 2014 was down $4.70 over 2013, and now with a flat June, we anticipate continuing increases in most of the coming months — but much more modest than in the past two years.
Regional rates displayed large differences. The Northeast and Northwest showed healthy increases and the Southeast, Midwest and Southwest had more modest decreases. (Keep in mind that the regional averages are weighted by passenger volume to calculate the national average, so $0.14 national increase is not an arithmetic average of the five regional swings.)
The table and chart below show the monthly average rate quotes by region and nationally for the last 13 months.
Over the last 12 months, the Northeast’s average quote is at least $20 above the other four regions at close to $70, while the others are all in the $40-$50 range.

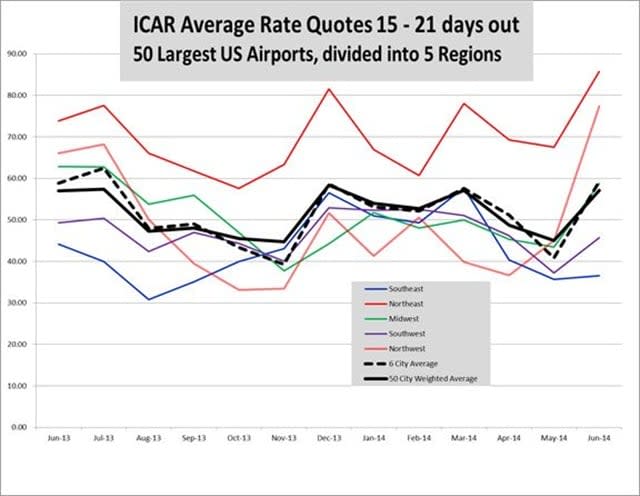
Rate data provided by Rate-Highway, a leading provider of revenue management services for the auto rental industry. Rates are an average of aggregator/OTA rates for all vendors present in the markets listed on the date of the survey. These tables and graph show the average of all base rate quotes per day for an ICAR at the six or 50 airports shown, for arrivals 15 to 21 days ahead of the date of the survey, for two- and seven-day rentals.
More Rental Operations

Stop Losing Money On Rental Tolls
Regardless of your rental fleet size and structure, fleet managers, executives, and owners can gain valuable insights into an often-overlooked area of fleet operations.
Read More →
Rethink The Future To Avert A Race To The Bottom
Rental car operators heard a sobering industry message and a stern challenge at the close of the International Car Rental Show.
Read More →
DriveItAway, Free2move Plan Shared Fleet Program for Independent Rental Fleet Operators
Vehicles would be placed with participating rental operations to support car renter demand and provide additional fleet capacity.
Read More →
Stellantis Recalls 1.3 Million Jeep Vehicles Worldwide Over Fire Risk
Stellantis is recalling more than 1.3 million Jeep Wrangler and Gladiator models worldwide over a fire risk linked to power steering pump wiring.
Read More →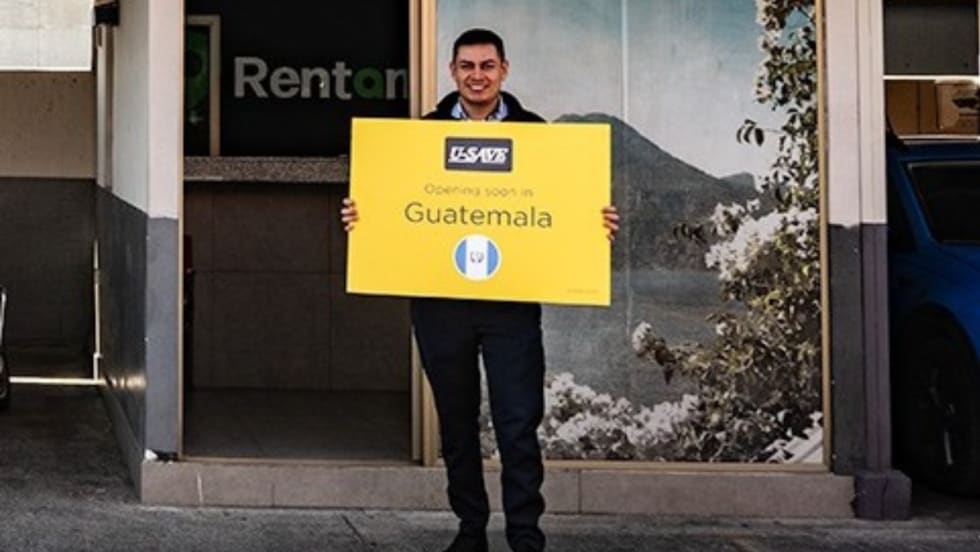
Green Motion And U-Save Open Rental Operations In Guatemala
The brands will open their first rental car outlets in the country at La Aurora International Airport in Guatemala City.
Read More →
U.S. Business Travel Drives $623 Billion+ in Economic Impact as Spending Reaches $538 Billion
The data also underscores the industry’s strong multiplier effect across the U.S. economy, revealing that each dollar invested in business travel in 2024 generated $1.16 in GDP.
Read More →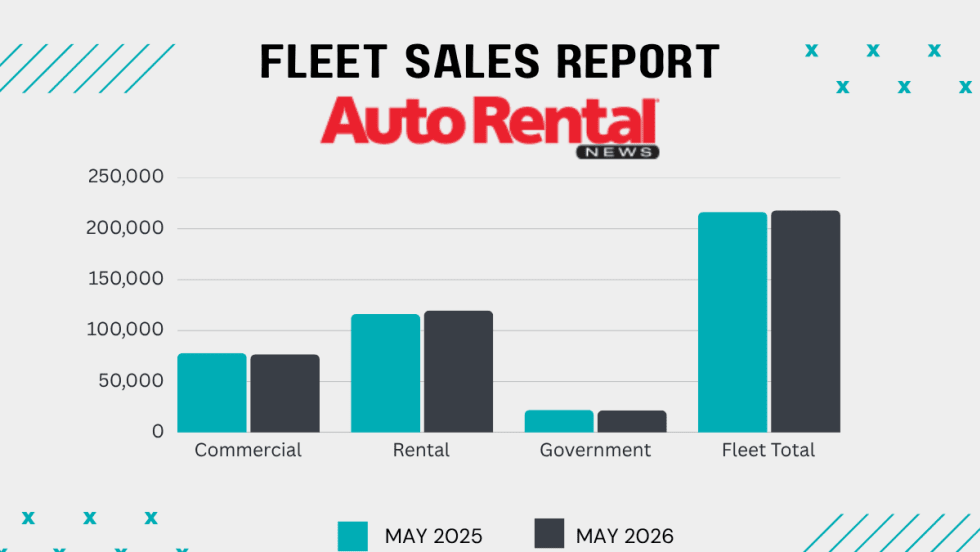
Rental Fleet Sales Skating Just Above 2025 Levels
The U.S. economy's continued growth and positive business investment are creating a favorable environment for fleet vehicle demand.
Read More →
Grow Your Rental Business Beyond Cars
Rental fleet operations are facing numerous evolving challenges and opportunities from AI technology to rate and revenue management, to customer service and business growth.
Read More →
Using AI to Create Clarity, Not Conflict, in Rental Car Damage
Rental companies still need people, policy, judgment, and thoughtful implementation, with operators remaining in control of the customer experience.
Read More →
Get Ready To Roll: No Stopping Self-Driving Rental Cars
The autonomous mobility technology revolution will move at its own pace, but sooner rather than later.
Read More →