

Car Rental Rates Stay Strong But Increases Slowing
In our monthly 6-city survey, March's rate quotes may signal an end to the substantial year-over-year increases that we have seen for the last five months.
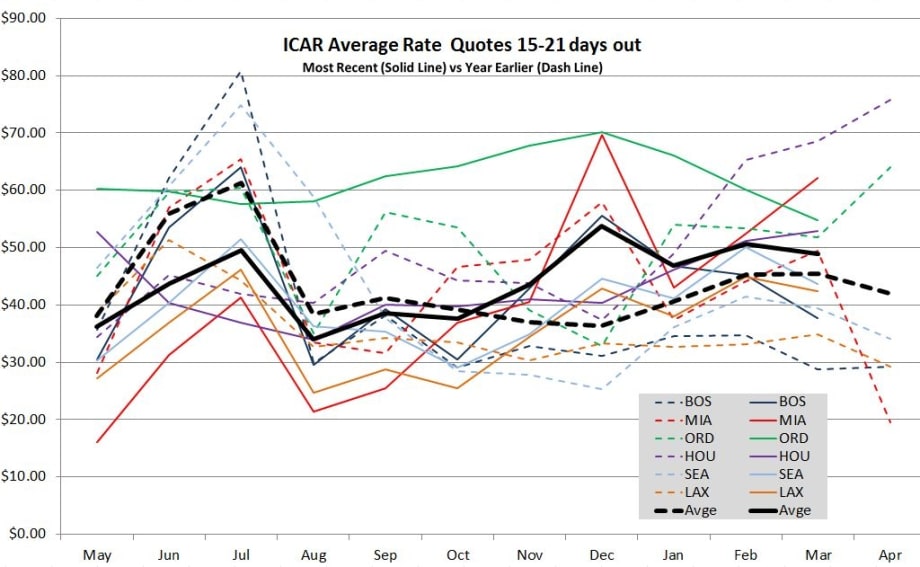
Click to enlarge. Rate data provided by Rate-Highway, a provider of revenue management services for the auto rental industry. Rates are an average of aggregator/OTA rates for all vendors present in the markets listed on the date of the survey.
With the help of Michael Meyer of Rate-Highway Inc. and Jim Tennant of The Tennant Group, Auto Rental News publishes monthly auto rental rate surveys for six major airports in the cities of Boston (BOS), Miami (MIA), Chicago (ORD), Houston (HOU), Seattle (SEA) and Los Angeles (LAX). The rates are based on weekly surveys and are published monthly.
Analysis and commentary provided by Jim Tennant of The Tennant Group. This survey is dated Feb. 4. There will also be a session on rates and rate management at the next Car Rental Show, April 15-16, 2013 at the Rio in Las Vegas.
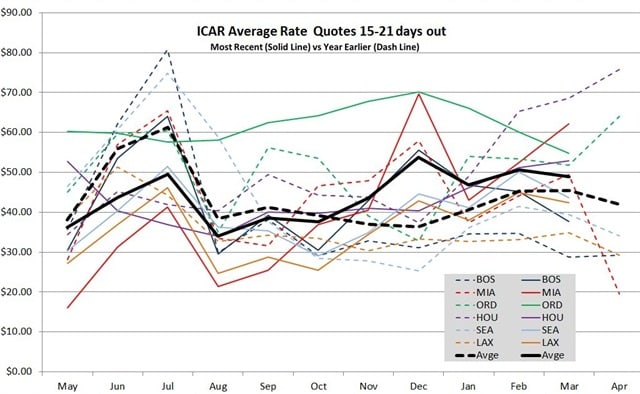
Click to enlarge. Rate data provided by Rate-Highway, a provider of revenue management services for the auto rental industry. Rates are an average of aggregator/OTA rates for all vendors present in the markets listed on the date of the survey.
The March 2013 6-city average rate quotes continued to be higher than a year earlier, up $3.47 from March 2012. The five weekly quotes which make up the monthly average were interesting: The year-over-year changes by week were (in chronological order) +$11.99, +$13.75, -$5.40, -$3.66 and +$0.65. This may signal an end to the substantial year-over-year increases that we have seen for the last five months.
Houston’s almost stratospheric rates in early 2012 have come back to a level comparable with other cities, a large decease from a year ago. Chicago’s rate run-up of a few months ago has ended – its rates are also back to more normal levels.
Miami continued to be very strong, but this year’s early Easter and accompanying spring breaks may have strengthened March’s quotes. (Easter occurs in March only about 22% of the time.)
Rate Change Comparisons Year-On-Year | |||||||||
|---|---|---|---|---|---|---|---|---|---|
July-12 | Aug-12 | Sept-12 | Oct-12 | Nov-12 | Dec-12 | Jan-13 | Feb-13 | Mar-13 | |
BOS | (16.74) | (0.21) | 1.14 | 1.52 | 10.11 | 24.44 | 12.32 | 10.52 | 9.02 |
MIA | (24.27) | (11.98) | (6.02) | (9.79) | (7.28) | 11.67 | 5.74 | 8.24 | 12.74 |
ORD | (2.86) | 22.96 | 6.24 | 10.64 | 28.72 | 37.24 | 12.14 | 6.81 | 3.02 |
HOU | (5.01) | (6.54) | (9.46) | (4.50) | (2.88) | 2.88 | (2.76) | (14.00) | (15.78) |
SEA | (23.25) | (22.59) | (2.29) | 0.53 | 7.10 | 19.31 | 4.90 | 8.65 | 4.16 |
LAX | 1.90 | (7.87) | (5.50) | (7.91) | 4.11 | 9.64 | 5.29 | 11.73 | 7.63 |
6-City Avg. | (11.71) | (4.37) | (2.65) | (1.58) | 6.65 | 17.53 | 6.27 | 5.32 | 3.47 |
This chart compares rate changes by month over the previous year. So July-12 data reflects rate change over July 2011.
These tables and graph show the average of all base rate quotes per day for an ICAR at the six airports shown for arrivals 15 to 21 days ahead of the date of the survey, for two- and seven-day rentals. If the arrival date is a Friday or Saturday, the two-day rate will be a weekend rate, otherwise it will be a regular rate.
More Rental Operations

Rethink The Future To Avert A Race To The Bottom
Rental car operators heard a sobering industry message and a stern challenge at the close of the International Car Rental Show.
Read More →
DriveItAway, Free2move Plan Shared Fleet Program for Independent Rental Fleet Operators
Vehicles would be placed with participating rental operations to support car renter demand and provide additional fleet capacity.
Read More →
Stellantis Recalls 1.3 Million Jeep Vehicles Worldwide Over Fire Risk
Stellantis is recalling more than 1.3 million Jeep Wrangler and Gladiator models worldwide over a fire risk linked to power steering pump wiring.
Read More →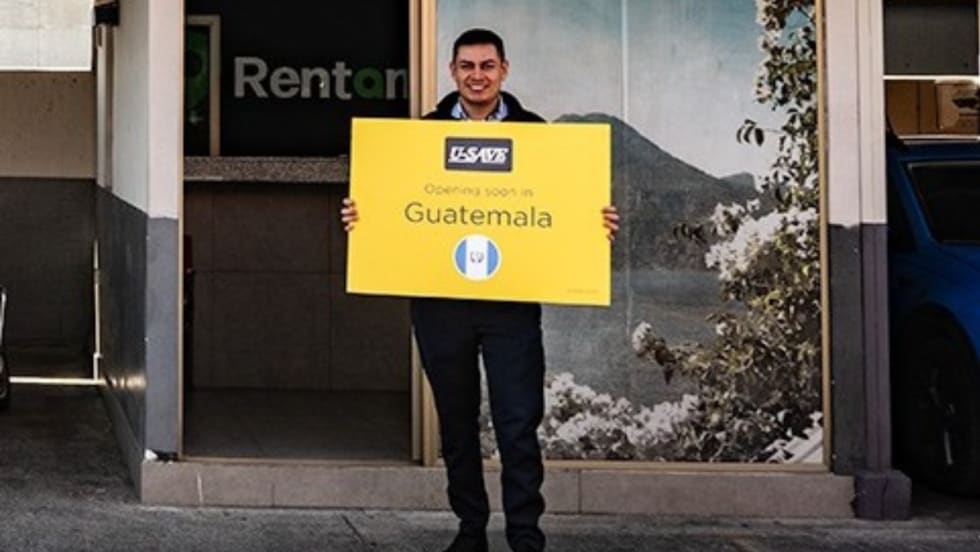
Green Motion And U-Save Open Rental Operations In Guatemala
The brands will open their first rental car outlets in the country at La Aurora International Airport in Guatemala City.
Read More →
U.S. Business Travel Drives $623 Billion+ in Economic Impact as Spending Reaches $538 Billion
The data also underscores the industry’s strong multiplier effect across the U.S. economy, revealing that each dollar invested in business travel in 2024 generated $1.16 in GDP.
Read More →
Rental Fleet Sales Skating Just Above 2025 Levels
The U.S. economy's continued growth and positive business investment are creating a favorable environment for fleet vehicle demand.
Read More →
Grow Your Rental Business Beyond Cars
Rental fleet operations are facing numerous evolving challenges and opportunities from AI technology to rate and revenue management, to customer service and business growth.
Read More →
Using AI to Create Clarity, Not Conflict, in Rental Car Damage
Rental companies still need people, policy, judgment, and thoughtful implementation, with operators remaining in control of the customer experience.
Read More →
Get Ready To Roll: No Stopping Self-Driving Rental Cars
The autonomous mobility technology revolution will move at its own pace, but sooner rather than later.
Read More →
Southwest Airlines Selects CarTrawler For Its Car Rental Booking Platform
The platform is designed to allow customers to compare and book rental vehicles more easily during the travel booking process.
Read More →