

Last Year Look:LOR Trends Down Slightly
Length of Rental Numbers Show Steady Decreases from Post-COVID Highs
Many auto repairers are finding ways to anticipate and operate in the new normal, but challenging market conditions remain.
April 30, 2024
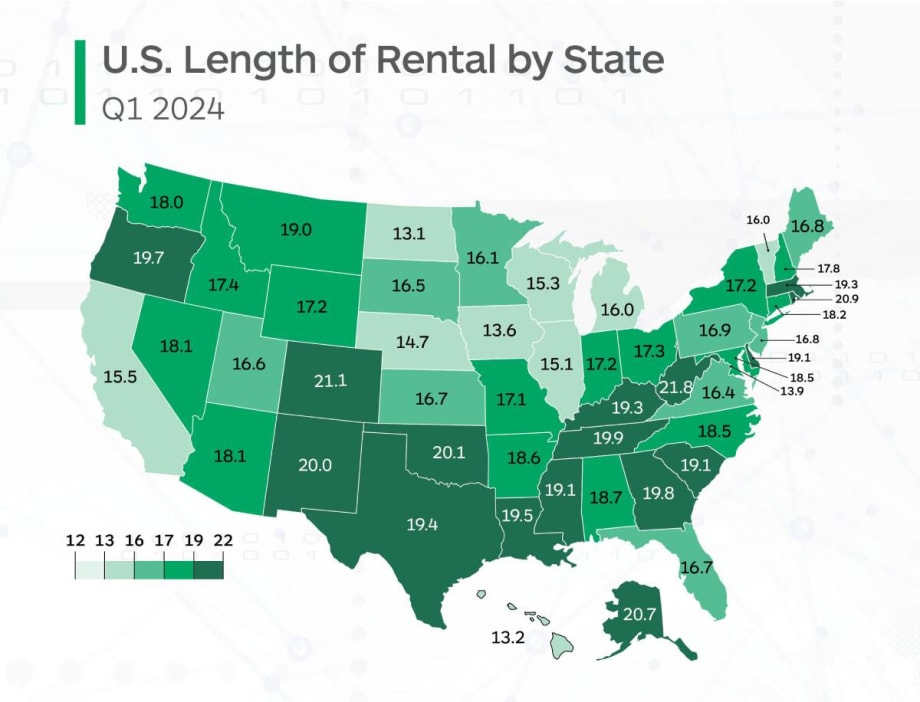
West Virginia had the highest overall LOR at 21.8 days, a 0.6-day increase from Q1 2023. Colorado had the second-highest LOR at 21.1 days, followed by Rhode Island (20.9) and Alaska (20.7). North Dakota had the lowest LOR with 13.1 days, a 1.5-day drop from Q1 2023. Hawaii wasn’t far behind at 13.2 days, followed by Iowa at 13.6 days.
Graphic: Enterprise-Rent-A-Car
5 min to read
The overall length of rental (LOR) for collision-related rentals in the U.S. in Q1 2024 was 17.6 days, a 1.1-day decline from Q1 2023, according to an LOR report released April 29 by Enterprise Rent-A-Car.
Traditionally, LOR decreases in the first quarter of each year, a trend that continued. LOR has shown steady decreases from the post-COVID highs, with Q1 2023’s 18.7 days and Q1 2022’s 18.2 days, but it is still higher than what Enterprise observed in Q1 2021 (13.3 days) and Q1 2020 (13.2 days).
As the numbers show, a traditional trend of seasonal LOR continues; the LOR decrease is positive, and many repairers are finding ways to anticipate and operate in the new normal. However, challenging market conditions remain, and overall LOR remains significantly higher than it was pre-pandemic.
“The continued decline in LOR in Q1 2024 aligns with the decline we’ve seen with repair shops’ backlog of work in the same timeframe,” said John Yoswick, editor of the weekly CRASH Network newsletter, in the report. “On a national basis, the average backlog reached a two-year low in January — just shy of four weeks. That’s down by nearly two full weeks since the high of 5.8 weeks in the first quarter of 2023. But the average backlog remains significantly higher than the same period in January 2020 (2.1 weeks) and January 2021 (1.6 weeks).”
Yoswick added, “We’re also seeing continued decline in the amount of work-in-process (WIP) that shops have, which often benefits throughput (and can be another sign that parts-related challenges are easing a bit). We measure WIP as the number of repair jobs that a shop has in-process compared to that shop’s typical monthly repair job count.”
The more than 550 shops that shared data with us in March had WIP that on average was equal to 57% of their typical monthly volume, he said. That was down 11 points from the prior quarter, and 8 percentage points lower than a year earlier.”
California Sees Largest Drivable Decrease
For rentals associated with drivable claims, LOR was 15.8 days, a relatively minor 0.3-day drop from Q1 2023.
Rhode Island had the highest drivable LOR at 19.3 days, followed by Colorado at 19 days. West Virginia had the highest drivable increase, up 1.6 days to 17.6. New Mexico also saw a significant increase, up 1.2 to 18 days.
Twenty other states, plus Washington, D.C., had drivable increases in Q1 2024. The lowest drivable LOR was North Dakota with 10.4 days, followed by Hawaii at 11.8 days and Iowa at 12 days. California saw the largest drivable decrease, down 1.2 days, with Utah close behind with a full one-day decrease.
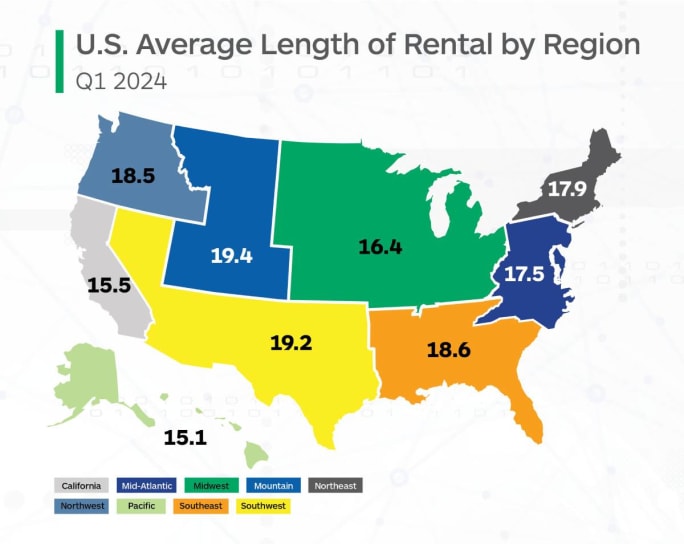
The Southwest region (which includes California) reported a 1.9-week average backlog in January, a small increase from the prior quarter, but still the shortest average backlog of any region. The New England states reported a one-week jump in backlog to an average of 5.3 weeks, perhaps because of several snow events in January. The average backlog remained flat or down in the other parts of the country; the largest decline was in the Pacific Northwest, where the average fell 2.2 weeks to 4.7 weeks.
Graphic: Enterprise-Rent-A-Car
More Shops Speed Up Non-Drivable Repair Claims
Non-drivable LOR in the U.S. was 25 days in Q1 2024, a 2.5-day drop from Q1 2023.
West Virginia recorded the highest non-drivable LOR at 33.2 days. Colorado (30.6 days), Montana (30.5 days), New Mexico (30.4 days) and Alaska (30.2 days) all had non-drivable LOR greater than 30 days. D.C. had the lowest non-drivable LOR with 20.6 days, followed by Iowa (21.0 days) and New York (21.9 days).
Vermont was the only state to record a higher non-drivable LOR over last year, as their Q1 2024 result of 27.5 days represented a 1.1-day increase. South Dakota had the largest decrease, down six full days to 24.7 days. Both Louisiana and Washington had decreases greater than five full days (5.3 days and 5 days, respectively). Thirteen additional states, plus D.C., had non-drivable decreases greater than three days, with 29 additional states notching decreases greater than a full day.
“The percentage of shops in January that said they could schedule a job within two weeks (33%) was virtually unchanged from Q4 of 2023 but was 20 points higher than a year earlier when just 13% of shops could schedule new work within two weeks,” Yoswick said.
He also observed that a backlog decline of any percentage between October and January is notable: “The first quarter is traditionally the busiest of the year, and in the eight-year history of backlog tracking through the ‘Who Pays for What?’ surveys, there had never been a decline in backlog between October and January. That might suggest the drop in backlog is more dramatic than the 1.3-day decline (compared to Q4 of 2023) reflects.”
Total Loss LOR Drops Two Days YOY
LOR associated with total loss claims was 16.4 days in Q1 2024, a two-day drop from Q1 2023. West Virginia had the highest LOR at 20.1 days, followed by Kentucky at 19.4 days. North Dakota had the lowest LOR at 14.4 days, beating out Florida at 14.6 days and Iowa at 14.7 days.
As with non-drivable rentals, Vermont was the only state to see an increase in total loss LOR, up 0.9 days to 18.8 days. Alabama’s total loss LOR of 16.4 days was unchanged. Montana had the highest decrease, down 8.1 days to 15.8 days, beating the second-highest decrease in Washington (17.6 days, down 6.1). Twenty-eight other states had total loss decreases greater than two days.
“Overall, repairable claims volume fell by 0.87% in Q1 2024 compared to Q1 2023, fueled primarily by mild weather conditions in January through March,” said Ryan Mandell, director of claims performance for Mitchell International, in the report. “A cooling used vehicle market also drove total loss frequency higher (20.8% in Q1 2024 vs 20.1% in Q1 2023). Overall total loss market values decreased by 1.96% in Q1 2024 compared to Q1 2023."
More Rental Operations

The Desk Upsell Is Costing Operators More Than it Earns
Counter upsells generate revenue, but they can also slow transactions, erode trust, and cost repeat business. Fully inclusive pricing may offer operators a better path to long-term value.
Read More →
U-Save Expands Indian Ocean Presence with New Master Franchise for Mauritius
The franchise has been acquired by Mauritian travel entrepreneur Umarfarooq Omarjee, an established figure in the island's tourism and mobility sector.
Read More →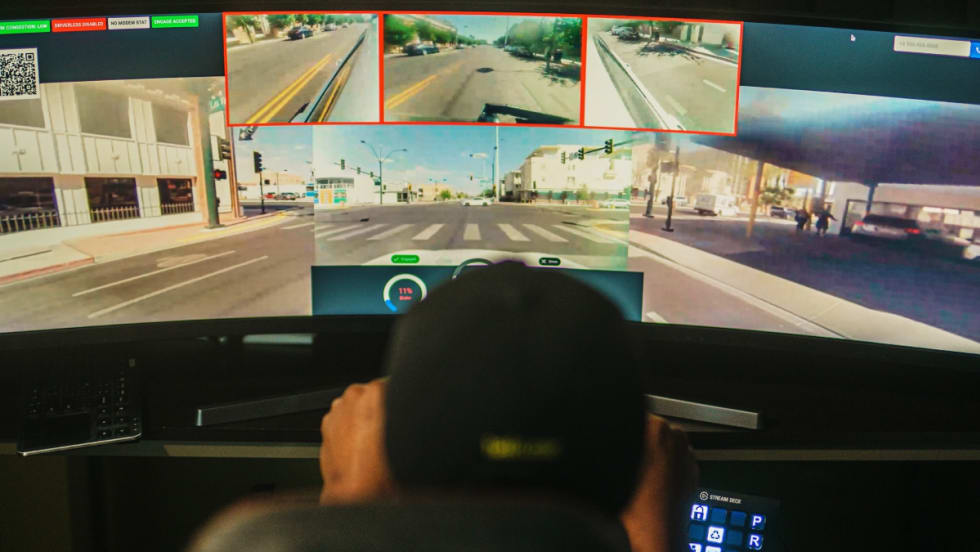
Global Carsharing Fleet Projected to Reach 768,000 Vehicles By 2030
A new Berg Insight forecast outlines several business models driving the projected growth in public carsharing worldwide through 2029.
Read More →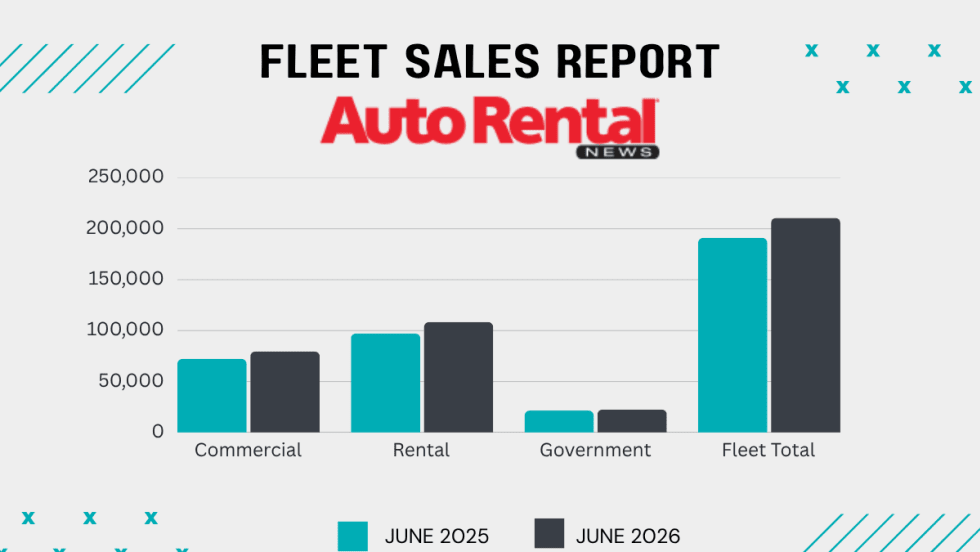
Rental Car Fleet Sales Show Mid-Year Strength
June gains ensured rental fleets closed out the first half of 2026 in positive territory.
Read More →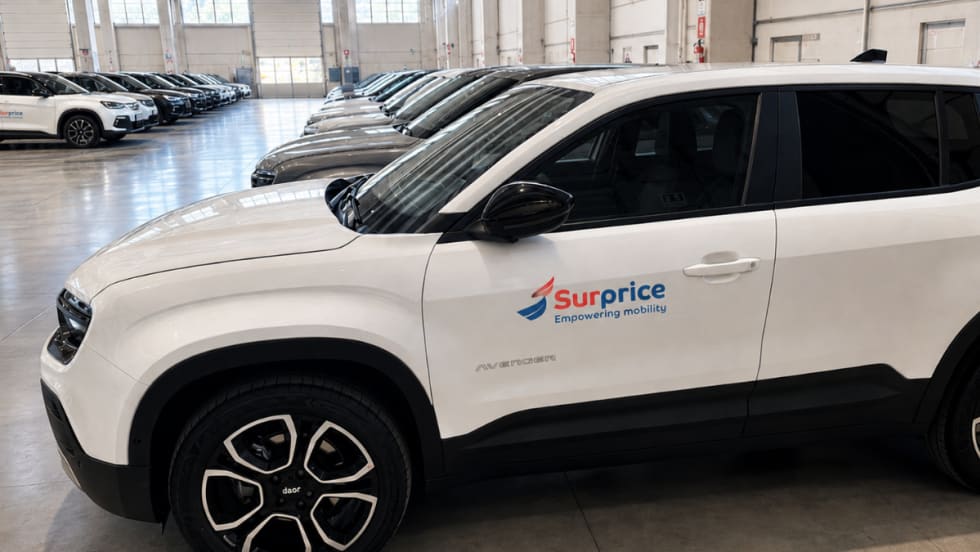
Surprice Mobility Opens Corporate Rental Station at Milan Malpensa Airport
The Milan opening is part of Surprice Mobility's broader strategy to expand its corporate operations while increasing the use of technology across its network.
Read More →
Brazilian Executive MBA Targets Growing Domestic Rental Car Industry
Rental car companies face a unique combination of challenges that are rarely addressed in traditional programs.
Read More →
Green Motion Expands Into Japan With Master Franchise Agreement
Japan's tourism industry, business travel market, and demand for vehicle rental services are reasons the country represents an important market for the company.
Read More →
ACRA Carrying Fuller Industry Load As AI and EVs Lurk In Future
The leading car rental professional business group details an active legislative, regulatory, and macro-trends agenda affecting car rental operators.
Read More →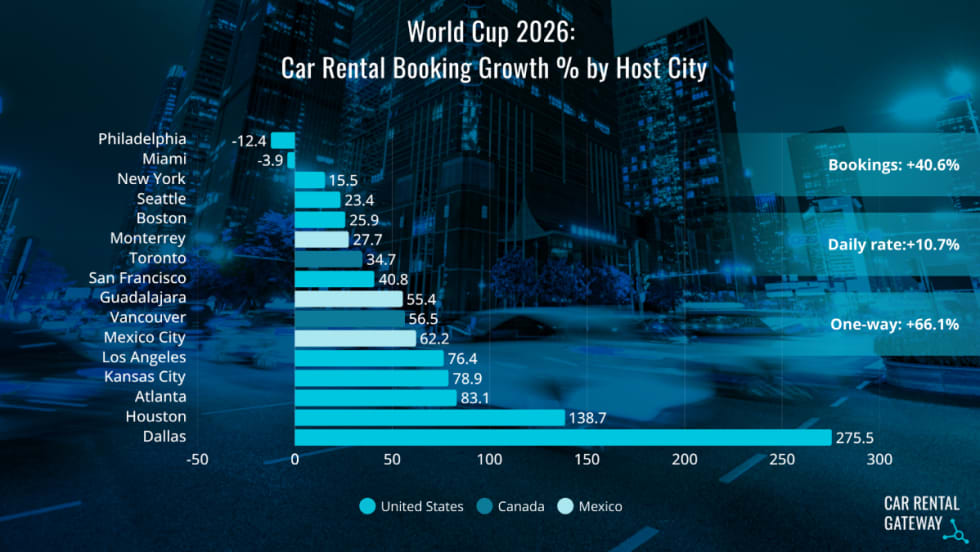
World Cup Travel Data Shows Longer Car Rentals and More One-Ways
A recent analysis of FIFA bookings found varied demand patterns that influenced rental car pricing.
Read More →
A Leveling Force: AI Morphs Into A Rental Car Profit-Seeker
Revenue managers can’t match the emerging AI tools gobbling lots of data that could counter the competitive race to the rate bottom.
Read More →