


National Tourism Office Shows Decline in International Inbound Travelers
The 2018 data of inbound traveler volume and spending for car renters shows that total arrivals have seen a steady decline within four years. The percentage of travelers from Asia has been growing while the European traveler base has shrunk.


Photo via pxhere.
Travel and tourism to the United States continued to shrink in 2018, with data from the U.S. Department of Commerce’s National and Tourism Office (NTTO) showing a 3% drop compared to the year previous in visitation arrivals — the third consecutive year the office has reported a decline.
Based off a survey of 9,689 inbound travelers, the NTTO gleaned a snapshot of 2018 travel trends, which showed an increase in trip planning, the number of women traveling, and inbound travelers from Asia; further, it shows a decrease in European travelers and prepaid packages.
However, while inbound foreign tourism declined by 3%, when visitors from Canada and Mexico are included, inbound tourism actually increased 3.5% in 2018.
For the fifth year, holiday/vacation travel led the way as the main reason for inbound U.S. travel (71%), followed by business (11%), and visiting friends/relatives (10.6%).
Inbound travelers also took fewer days to plan their trips. For 2018, travelers on average spent 118 days planning, while in 2017 they spent 122 days; in 2016 they took 114 days. The use of prepaid travel packages remained the same from the previous year (11.5%). However, it is still a decline from 2016, where 12.4% used a prepaid package, and 2014 where 13.9% used a prepaid package.
While the number of men traveling to the U.S. inched slightly from 60.8% in 2017 to 60.9% in 2019, it is still on the decline from previous years. In 2000, men made up 69.4% of inbound travelers. By 2014, 62.7% of respondents were men and by 2016, men made up 61.5%.
The decline in male respondents represents a rise in female travelers.
Florida and California remained the top two destinations for travelers, with Orlando and Los Angeles the top two city destinations. Eighteen percent selected Miami as their point of entry, while Los Angeles was chosen by 14.8% of respondents.
Similarly, 35.4% of participants said they went to an amusement park while in the U.S.; 40% of respondents visited national parks and monuments and 29.3% reported visiting historical monuments.
Europe remained the top exporter of inbound travelers, with 41.6% claiming a European country as their home. However, this is a decline from 43.2% of the previous year and is a continuation of a decline that began after 2004, when European travelers made up 55.7% of inbound travelers.
Following Europeans, people from Asian countries made up 25.1% of inbound travelers in 2018, with 8.1% from South Korea, and roughly 6% from Japan and China. While 25.1% is a 1.9% decrease from 2017, it still represents a steady rise in Asian travelers.
Next, 20.2% of respondents identified being from South America, with Brazilians comprising 9.1%.
In the U.S., tourism is a $1.62 trillion industry (both direct and indirect), representing 2.8% of the GDP and employing 7.8 million people, according to the NTTO.
Canada | 21.2 Million |
Mexico | 18.5 Million |
U.K. | 4.7 Million |
Japan | 3.5 Million |
China | 3 Million |
S. Korea | 2.2 Million |
Brazil | 2.2 Million |
Germany | 2.1 Million |
France | 1.8 Million |
India | 1.4 Million |
TOTAL | 79.6 Million |
2000 | 2005 | 2010 | 2013 | 2014 | 2015 | 2016 | 2017 | 2018 | |
Total Arrivals (000s) | 8,676 | 6,547 | 7,962 | 10,669 | 12,150 | 13,591 | 12,480 | 12,372 | 12,005 |
Percentage Change of Previous Year (%) | 4 | 6 | 15 | 11 | 14 | 12 | -8 | -1 | -3 |
More Rental Operations

The Desk Upsell Is Costing Operators More Than it Earns
Counter upsells generate revenue, but they can also slow transactions, erode trust, and cost repeat business. Fully inclusive pricing may offer operators a better path to long-term value.
Read More →
U-Save Expands Indian Ocean Presence with New Master Franchise for Mauritius
The franchise has been acquired by Mauritian travel entrepreneur Umarfarooq Omarjee, an established figure in the island's tourism and mobility sector.
Read More →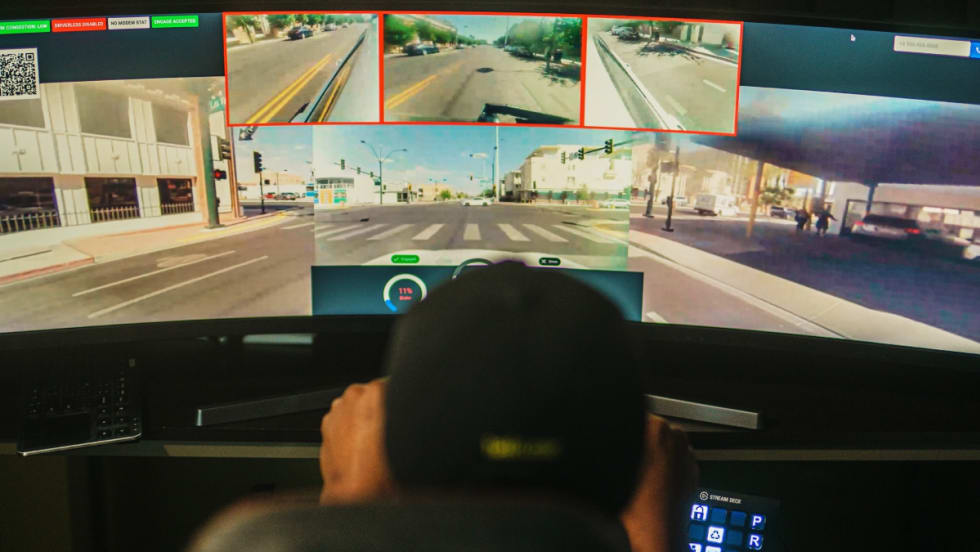
Global Carsharing Fleet Projected to Reach 768,000 Vehicles By 2030
A new Berg Insight forecast outlines several business models driving the projected growth in public carsharing worldwide through 2029.
Read More →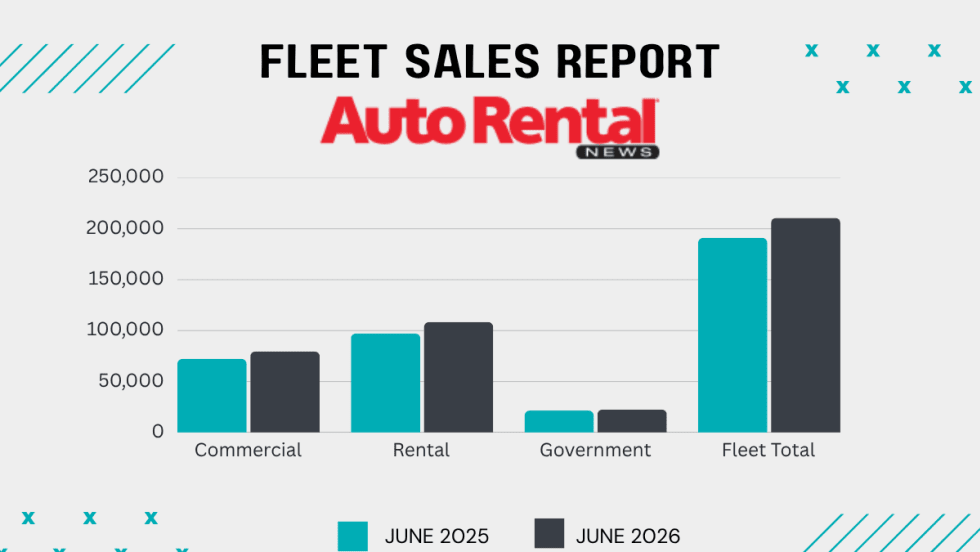
Rental Car Fleet Sales Show Mid-Year Strength
June gains ensured rental fleets closed out the first half of 2026 in positive territory.
Read More →
Surprice Mobility Opens Corporate Rental Station at Milan Malpensa Airport
The Milan opening is part of Surprice Mobility's broader strategy to expand its corporate operations while increasing the use of technology across its network.
Read More →
Brazilian Executive MBA Targets Growing Domestic Rental Car Industry
Rental car companies face a unique combination of challenges that are rarely addressed in traditional programs.
Read More →
Green Motion Expands Into Japan With Master Franchise Agreement
Japan's tourism industry, business travel market, and demand for vehicle rental services are reasons the country represents an important market for the company.
Read More →
ACRA Carrying Fuller Industry Load As AI and EVs Lurk In Future
The leading car rental professional business group details an active legislative, regulatory, and macro-trends agenda affecting car rental operators.
Read More →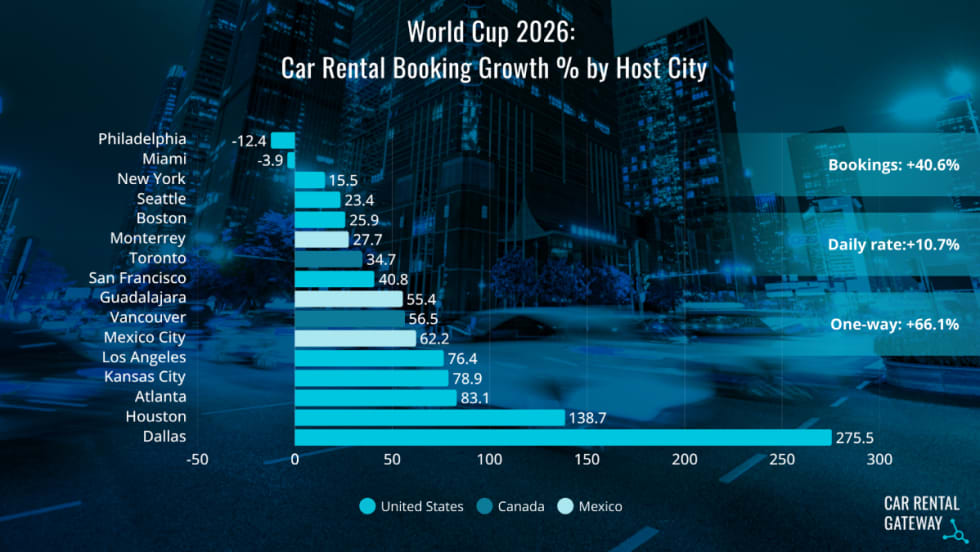
World Cup Travel Data Shows Longer Car Rentals and More One-Ways
A recent analysis of FIFA bookings found varied demand patterns that influenced rental car pricing.
Read More →
A Leveling Force: AI Morphs Into A Rental Car Profit-Seeker
Revenue managers can’t match the emerging AI tools gobbling lots of data that could counter the competitive race to the rate bottom.
Read More →