


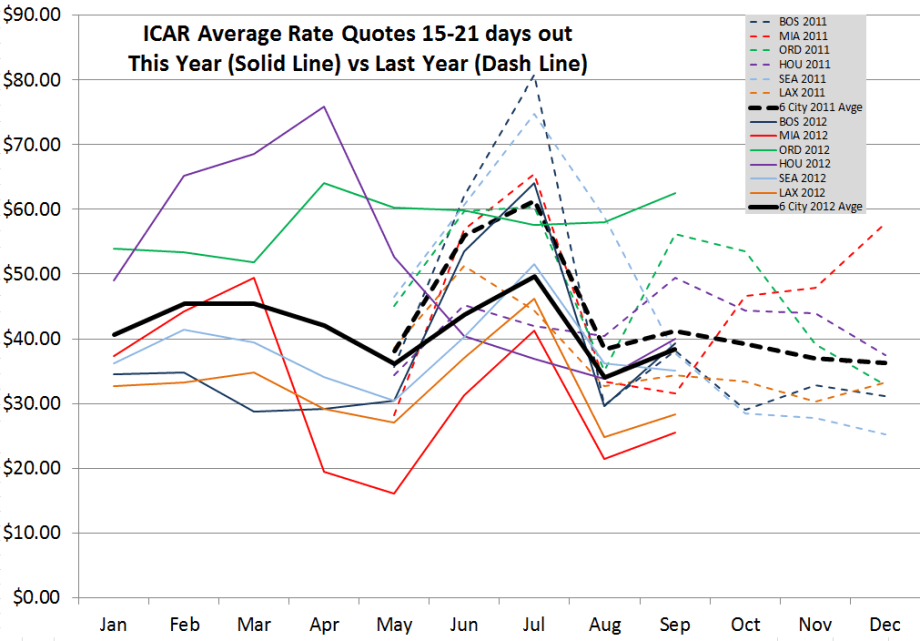
In September's Car Rental Rate Analysis, Boston and Chicago Rates Up Over 2011
In the six-city car rental rate analysis by The Tennant Group and Rate-Highway, four of the cities were down compared to 2011, while Boston and Chicago were up. Chicago's rates showed the most strength.
Rate data provided by Rate-Highway, a provider of revenue management services for the auto rental industry. Rates are an average of aggregator/OTA rates for all vendors present in the markets listed on the date of the survey.
With the help of Michael Meyer of Rate-Highway Inc. and Jim Tennant of The Tennant Group, Auto Rental News publishes monthly auto rental rate surveys for six major airports in the cities of Boston, Miami, Chicago, Houston, Seattle and Los Angeles. The rates are based on weekly surveys.
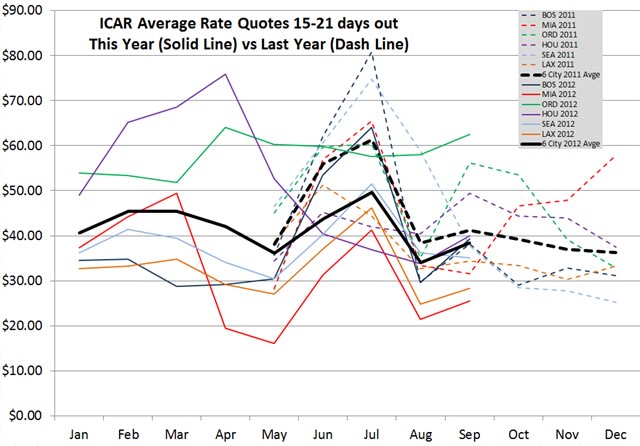
Analysis and commentary provided by Jim Tennant of The Tennant Group. This survey is dated Oct. 2. (Click on the graph below for a larger view.)
Rate data provided by Rate-Highway, a provider of revenue management services for the auto rental industry. Rates are an average of aggregator/OTA rates for all vendors present in the markets listed on the date of the survey.
Rate quotes have now been collected weekly since May 2011, giving five months of year-to-year comparisons.
Rates have been lower every month in 2012 compared to 2011 in the data available, but the gap has narrowed considerably in the last two months from the large differences seen in June and July. September 2012 was just $2.79 lower than last year — a considerable improvement from the $12.25 drop seen in June.
Looking at the year-to-year results in individual cities, Boston and Chicago were up in September, while Seattle, Miami, Los Angeles and Houston were all down and in the sequence named.
In absolute terms, Chicago’s more than $60/day shows considerable strength, and Houston, Boston and Seattle in the mid- to high-$30s are about where one would expect. Miami reflects the low shoulder season period, while Los Angeles is surprisingly low at under $30.
ICAR Average Rate Quotes | |||||
|---|---|---|---|---|---|
May | Jun | Jul | Aug | Sep | |
BOS | 35.60 | 62.15 | 80.80 | 29.79 | 38.11 |
MIA | 28.19 | 56.92 | 65.51 | 33.44 | 31.52 |
ORD | 45.01 | 59.71 | 60.46 | 35.10 | 56.22 |
HOU | 34.35 | 45.17 | 41.91 | 40.40 | 49.45 |
SEA | 46.54 | 60.67 | 74.80 | 58.86 | 37.70 |
LAX | 38.56 | 51.30 | 44.33 | 32.63 | 34.31 |
6 City Avg. | 38.04 | 55.99 | 61.30 | 38.37 | 41.22 |
ICAR Average Rate Quotes- Monthly Averages in 2012 | |||||
|---|---|---|---|---|---|
May | Jun | Jul | Aug | Sep | |
BOS | 30.47 | 53.51 | 64.05 | 29.58 | 39.25 |
MIA | 16.04 | 31.34 | 41.24 | 21.46 | 25.50 |
ORD | 60.23 | 59.81 | 57.60 | 58.06 | 62.46 |
HOU | 52.69 | 40.42 | 36.89 | 33.86 | 39.99 |
SEA | 30.37 | 40.33 | 51.55 | 36.26 | 35.08 |
LAX | 27.12 | 36.99 | 46.23 | 24.76 | 28.26 |
6 City Avg. | 36.16 | 43.73 | 49.59 | 34.00 | 38.42 |
2012 vs. 2011 | |||||
|---|---|---|---|---|---|
May | Jun | Jul | Aug | Sep | |
BOS | (5.12) | (8.65) | (16.74) | (0.21) | 1.14 |
MIA | (12.15) | (25.58) | (24.27) | (11.98) | (6.02) |
ORD | 15.22 | 0.11 | (2.86) | 22.96 | 6.24 |
HOU | 18.34 | (4.75) | (5.01) | (6.54) | (9.46) |
SEA | (16.17) | (20.34) | (23.25) | (22.59) | (2.61) |
LAX | (11.44) | (14.32) | 1.90 | (7.87) | (6.05) |
6 City Avg. | (1.89) | (12.25) | (11.71) | (4.37) | (2.79) |
These tables and graph show the average of all base rate quotes per day for an ICAR at the six airports shown for arrivals 15 to 21 days ahead of the date of the survey, for two- and seven-day rentals. If the arrival date is a Friday or Saturday, the two-day rate will be a weekend rate, otherwise it will be a regular rate.
More Rental Operations

Surprice Mobility Opens Corporate Rental Station at Milan Airport
The Milan opening is part of Surprice Mobility's broader strategy to expand its corporate operations while increasing the use of technology across its network.
Read More →
Brazilian Executive MBA Targets Growing Domestic Rental Car Industry
Rental car companies face a unique combination of challenges that are rarely addressed in traditional programs.
Read More →
Green Motion Expands Into Japan With Master Franchise Agreement
Japan's tourism industry, business travel market, and demand for vehicle rental services are reasons the country represents an important market for the company.
Read More →
ACRA Carrying Fuller Industry Load As AI and EVs Lurk In Future
The leading car rental professional business group details an active legislative, regulatory, and macro-trends agenda affecting car rental operators.
Read More →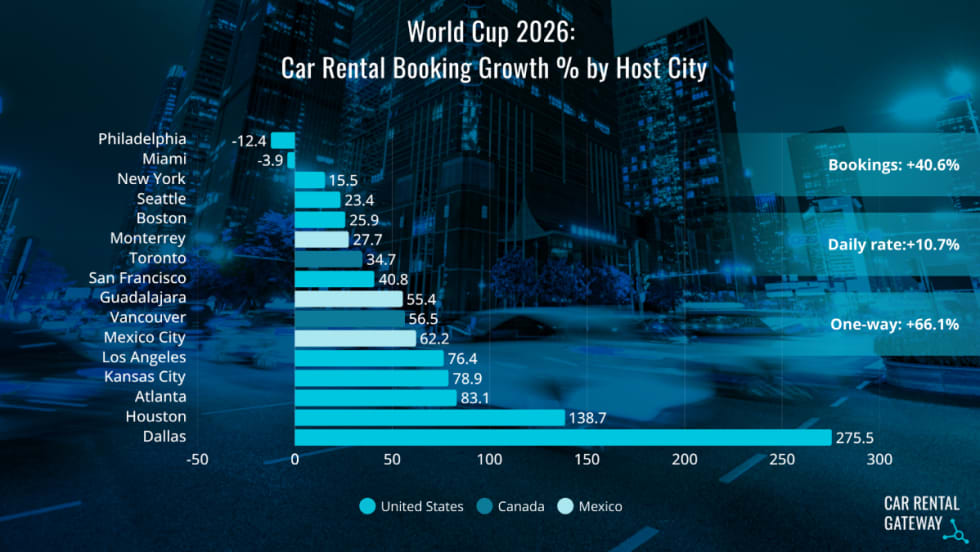
World Cup Travel Data Shows Longer Car Rentals and More One-Ways
A recent analysis of FIFA bookings found varied demand patterns that influenced rental car pricing.
Read More →
A Leveling Force: AI Morphs Into A Rental Car Profit-Seeker
Revenue managers can’t match the emerging AI tools gobbling lots of data that could counter the competitive race to the rate bottom.
Read More →
Stop Losing Money On Rental Tolls
Regardless of your rental fleet size and structure, fleet managers, executives, and owners can gain valuable insights into an often-overlooked area of fleet operations.
Read More →
Rethink The Future To Avert A Race To The Bottom
Rental car operators heard a sobering industry message and a stern challenge at the close of the International Car Rental Show.
Read More →
DriveItAway, Free2move Plan Shared Fleet Program for Independent Rental Fleet Operators
Vehicles would be placed with participating rental operations to support car renter demand and provide additional fleet capacity.
Read More →
Stellantis Recalls 1.3 Million Jeep Vehicles Worldwide Over Fire Risk
Stellantis is recalling more than 1.3 million Jeep Wrangler and Gladiator models worldwide over a fire risk linked to power steering pump wiring.
Read More →