



New Car Sales Improve in May
According to data from Kelley Blue Book and TrueCar, new car sales look strong for May.
New car sales will hit 15 million seasonally adjusted annual rate (SAAR) in May, which is an expected 6% year-over-year improvement, according to Kelley Blue Book, a provider of new and used car information.
"The Big Three will continue to benefit from a strong pickup truck market, with each domestic automaker anticipated to post gains slightly better than the overall industry average," said Alec Gutierrez, Kelley Blue Book’s senior market analyst of automotive insights. "Meanwhile, Nissan is expected to post the single largest gain in sales this month, thanks to strong demand for the redesigned Altima, Sentra and Rogue, each of which experienced an increase of greater than 30 percent in sales last month."
Similar to previous years, Kelley Blue Book expects a surge in new vehicle sales during Memorial Day weekend, since manufacturers typically offer some of the most attractive incentives of the year. For example, Chevrolet is offering $500 in Memorial Day cash, in addition to some of the offers available on their most popular models.
Sales Volume 1 | Market Share 2 | |||||
Manufacturer | 13-May | 12-May | YOY % | 13-May | 12-May | YOY |
General Motors | 259,000 | 245,256 | 5.60% | 18.30% | 18.40% | -0.10% |
Ford Motor Company | 235,000 | 216,257 | 8.70% | 16.60% | 16.20% | 0.40% |
Toyota Motor Company | 200,000 | 202,973 | -1.50% | 14.10% | 15.20% | -1.10% |
Chrysler Group | 161,000 | 150,041 | 7.30% | 11.40% | 11.20% | 0.10% |
American Honda | 138,500 | 133,997 | 3.40% | 9.80% | 10.00% | -0.30% |
Hyundai-Kia | 115,000 | 118,790 | -3.20% | 8.10% | 8.90% | -0.80% |
Nissan North America | 110,000 | 91,794 | 19.80% | 7.80% | 6.90% | 0.90% |
Volkswagen | 55,000 | 50,361 | 9.20% | 3.90% | 3.80% | 0.10% |
Total 3 | 1,415,000 | 1,334,642 | 6.00% | - | - | - |
1 Historical data from OEM sales announcements
2 Kelley Blue Book Automotive Insights
3 Includes brands not shown
TrueCar Reports New Car Sales Up for May
TrueCar.com, a provider of new car pricing information and trends, today released its May 2013 sales and incentives forecast. The forecast includes the following:
For May 2013, new light vehicle sales in the U.S. (including fleet) is expected to be 1,435,495 units - up 8.5 percent from May 2012 and 12.1 percent from April 2013 (on an unadjusted basis).
The May 2013 forecast translates into a Seasonally Adjusted Annualized Rate ("SAAR") of 15.2 million new car sales, up from 14.9 million in April 2013 and from 13.9 million in May 2012.
Retail sales are up almost 6% compared to May 2012 and up 12% from April 2013.
Fleet and rental sales are expected to make up 20.2% of total industry sales in May 2013.
The industry average incentive spending per unit will be approximately $2,482 in May 2013, which represents a decrease of 3% from May 2012 and down 1.7% from April 2013.
Used car sales (sales from franchise dealerships, independent dealerships and private party sales) are estimated to be 3,345,674. The ratio of new to used is approximately 1:3 for May 2013.
"Full size truck sales continue to gain momentum in May, and we expect the segment to post a 22% increase compared to the nearly 9% industry increase," said Jesse Toprak , senior analyst for TrueCar.com. "Stability in the industry is now the norm, which is a positive for automakers as it results in the ability to optimize production levels, therefore improving profitability."
Forecasts for the top eight manufacturers for May 2013:
Unit Sales | |||
|---|---|---|---|
Manufacturer | May 2013 Forecast | % Change vs. April 2013 | % Change vs. May 2012 |
Chrysler | 139,436 | -10.40% | -6.20% |
Ford | 246,829 | 18.40% | 20.10% |
GM | 266,167 | 12.00% | 8.50% |
Honda | 143,107 | 9.20% | 6.80% |
Hyundai/Kia | 119,222 | 7.50% | 0.40% |
Nissan | 115,120 | 31.00% | 25.40% |
Toyota | 213,317 | 21.10% | 5.10% |
Volkswagen Group | 57,988 | 14.10% | 9.40% |
Industry | 1,435,495 | 12.10% | 8.50% |
Market Share | |||
|---|---|---|---|
Manufacturer | May 2013 Forecast | Apr-13 | May-12 |
Chrysler | 9.70% | 12.20% | 11.20% |
Ford | 17.20% | 16.30% | 15.50% |
GM | 18.50% | 18.60% | 18.50% |
Honda | 10.00% | 10.20% | 10.10% |
Hyundai/Kia | 8.30% | 8.70% | 9.00% |
Nissan | 8.00% | 6.90% | 6.90% |
Toyota | 14.90% | 13.80% | 15.30% |
Volkswagen Group | 4.00% | 4.00% | 4.00% |
Incentive Spending | ||||
|---|---|---|---|---|
Manufacturer | May 2013 Incentives | % Change vs. April 2013 | % Change vs. May 2012 | Total Spending |
Chrysler | $3,223 | -2.90% | 2.60% | $449,460,344 |
Ford | $2,990 | 2.30% | 12.70% | $737,986,768 |
GM | $3,254 | -10.50% | -3.40% | $865,975,132 |
Honda | $1,810 | 12.80% | -23.10% | $258,954,006 |
Hyundai/Kia | $1,405 | 1.60% | 13.10% | $167,477,888 |
Nissan | $1,821 | -15.90% | -34.20% | $209,688,952 |
Toyota | $1,925 | 22.50% | -2.20% | $410,560,641 |
Volkswagen Group | $2,393 | 1.20% | -5.90% | $138,759,116 |
Industry | $2,482 | -1.70% | -3.00% | $3,562,162,196 |
"Incentive spending has continued to decline in May, painting an even better picture of profitability for automakers," said Kristen Andersson, analyst for TrueCar.com. "In May, Nissan was the only major automaker to decrease incentive spending, post a double digit sales increase and gain a full percentage point of market share compared to last year, due to continued interest in the redesigned Altima."
More Rental Operations
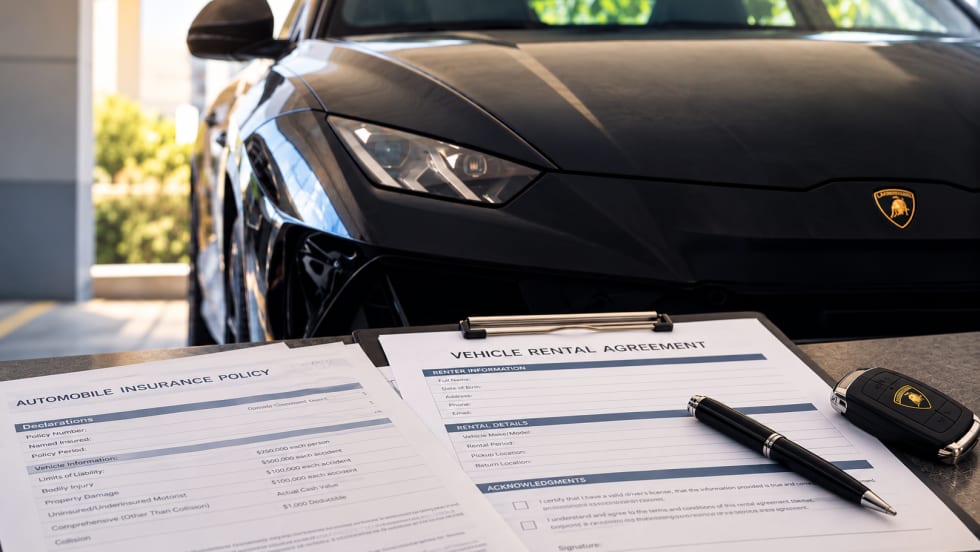
Clean on Paper: Red Flags in Exotic Car Rental Verification
A suspicious $45,000 Lamborghini booking reveals the strengths and limitations of renter verification, from forged insurance documents to coverage gaps and unauthorized drivers. (Part 2 of 3)
Read More →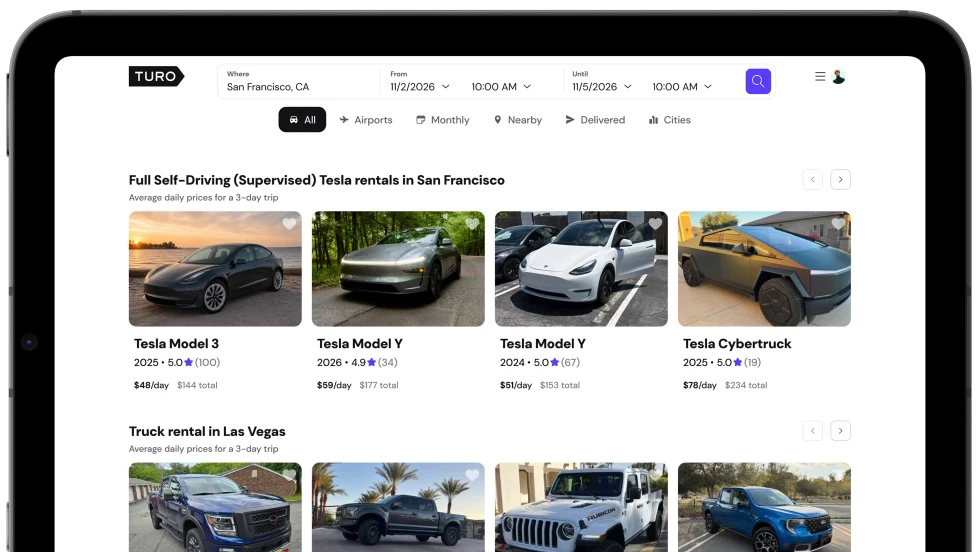
Turo and Tesla Take the Next Step Toward Autonomous Car Rentals
The partnership brings Tesla's Full Self-Driving (Supervised) technology into the rental experience, offering a glimpse of how increasingly automated vehicles could change car rental.
Read More →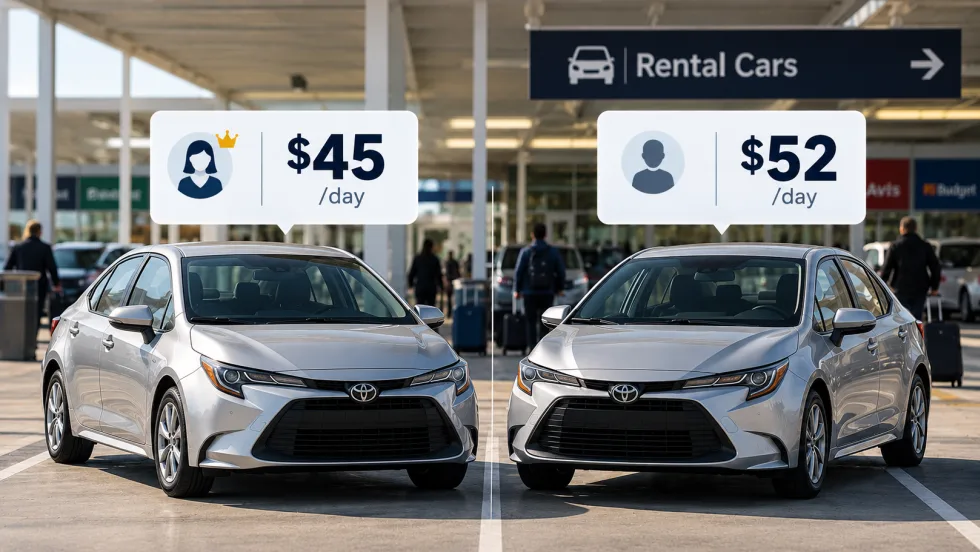
How Rental Operators Can Navigate Personalized Pricing Rules
As regulators scrutinize the use of customer data in pricing, rental operators need to know whether they can explain why one renter pays more than another.
Read More →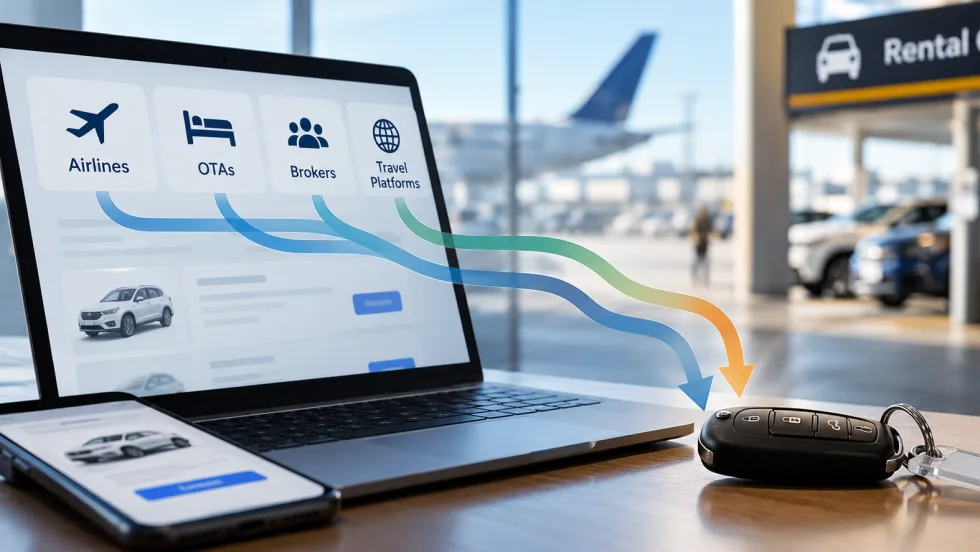
Direct, Broker or Hybrid? How Travel Retailers Source Rental Cars
As travel retailers weigh direct supplier relationships against third-party distribution, rental operators need to understand how those decisions affect their business.
Read More →
How Did This Independent Rental Operator Grow to 170 Vehicles in 4 Years?
With 170 vehicles across three Kentucky locations, Joel Price relies on an overseas team to handle reservations, payments, and after-hours customer service. It's one part of an unconventional approach to growing an independent rental operation.
Read More →
What Does It Take to Succeed in B2B Rentals?
The fundamentals may be familiar to daily car rental operators, but project-based truck rentals put different demands on the fleet and the business.
Read More →
NPR Builds on International Partnerships to Grow Rental Bookings
With Ana Laborde supporting broker development, NPR Auto Group is tailoring distribution strategies, rate packages, and partnerships to grow international reservations across its three brands.
Read More →
Advantage, Sixt Place Among Top Five in Annual Satisfaction Study
While Enterprise and National retain the top spots in JD Power’s 2026 rankings, the latest customer satisfaction results suggest renters can find competitive service beyond the biggest car rental names.
Read More →
The $100,000 Insurance Trap in Exotic Car Rentals
Exotic rental agencies often rely on customers’ personal auto policies to protect six-figure vehicles. But policy language can dramatically change the coverage for vehicles over $100,000 MSRP.
Read More →
The Booking Is Confirmed, But Is Your Customer Ready to Drive?
For international renters, a confirmed reservation doesn’t always mean they’re eligible to drive. Earlier checks can help operators catch documentation and payment issues before the customer reaches the counter.
Read More →