Report: Ride Hailing Accounted for 65% of Business Travel Expense Transaction Volume in 2017
Certify's annual review of business expense trends shows that car rental represented 25% of overall transaction volume in ground transportation in 2017. National Car Rental was the most expensed and top-rated brand in 2017, according to Certify data.
by Staff
February 7, 2018
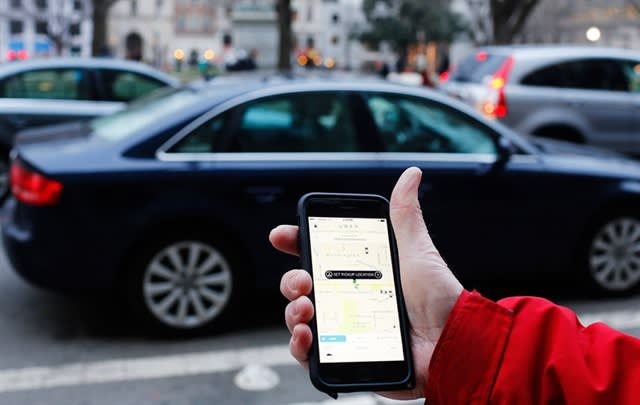
Photo via Mark Warner/Flickr
2 min to read
Photo via Mark Warner/Flickr
Automated travel and entertainment expense management software provider, Certify, announced the results of its fifth, full-year SpendSmart Report with analysis of U.S. business travel and expense spending trends for 2017.
The Certify SpendSmart report tracks business travel expense spending across major categories such as food, airlines, lodging, and car rental. The data is collated based on transaction volume, not overall revenue in each category.
Ad Loading...
Compared to 2016, ride hailing accounted for 68% of the overall transaction volume in the ground transportation category last year led by Uber and rival Lyft, respectively with 56% and 12% of the total.
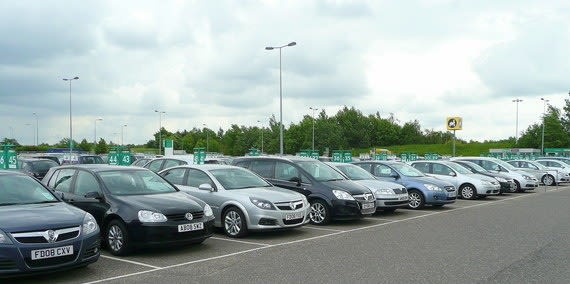
Elsewhere in the category, taxi held a 7% share of 2017 rides, down from 11% in 2016, and car rental lost 8% share of ground transportation transaction volume over the last four quarters to end the year at 25%.
Uber also claimed 9% of all expenses and receipts processed by Certify in 2017, a 3% increase over last year and 6% more than second place Starbucks.
Photo via Geograph.org.uk/Wikimedia
The Certify SpendSmart report tracks business travel expense spending across major categories such as food, airlines, lodging, and car rental. The report highlights top vendors and emerging trends with analysis of data from millions of expenses and receipts processed through the Certify system.
In car-rental specific categories, National Car Rental was the most expensed and top-rated brand in 2017, according to Certify data.
Ad Loading...
Most Expensed Car-Rental Services
National: 27.10%, averaging $185.61
Enterprise: 16.43%, averaging $199.17
Hertz: 13.95%, averaging $195.12
Avis: 11.97%, averaging $178.02
Budget: 3.72%, averaging $187.25
Top Rated Car-Rental Services
National: 4.4
Enterprise: 4.3
Hertz: 4.1
Avis: 4.0
Budget: 3.8
2017 T&E Expense Category Breakdown (% of total spending, benchmark average)
Rental operators can now detect and act on speeding while vehicles are still on rent, thereby reducing fines, admin workload, vehicle wear, and safety risks.
The combination brings actionable vehicle insights into PurCo’s PurInspect platform, improving damage detection and operational efficiency for rental fleets.
LOR related to insurance claims overall continues to trend downward, but ongoing market and economic conditions could affect future results while the industry deals with staffing and productivity challenges.
West Coast disasters pose unique challenges and liabilities for rental fleet operators, who are advised to take steps tailored to their specific situations.
Angry car renters are storming social media, the mainstream media, and online ratings platforms to complain about charges they claim are either unfounded or excessive.