

Car Rental Rates Continue Strong Year-Over-Year Results in January
In the monthly 6-city survey, Boston and Chicago continued to have double digit year-over-year increases and only Seattle had a small decrease from last year.
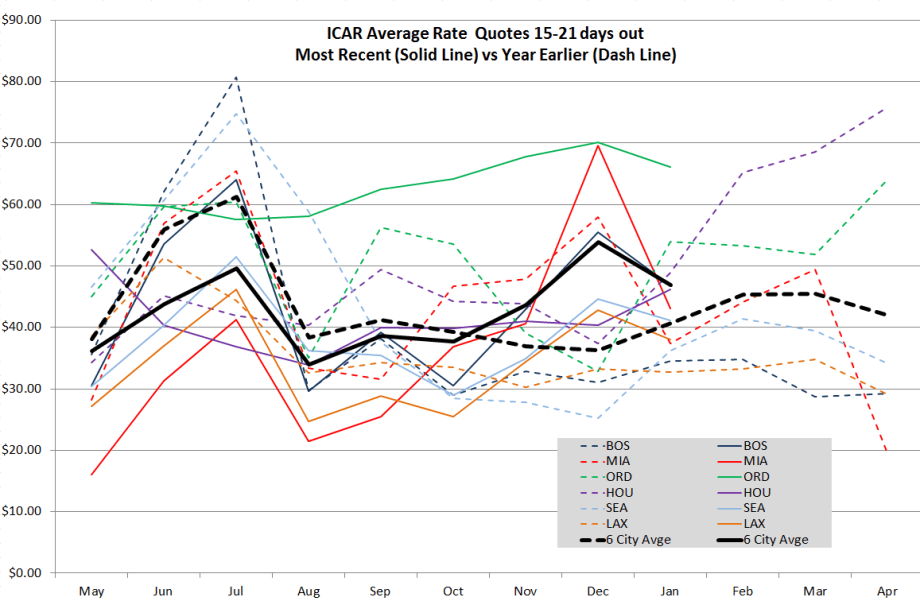
(Click to enlarge.)
Rate data provided by Rate-Highway, a provider of revenue management services for the auto rental industry. Rates are an average of aggregator/OTA rates for all vendors present in the markets listed on the date of the survey.
(Click to enlarge.)
Rate data provided by Rate-Highway, a provider of revenue management services for the auto rental industry. Rates are an average of aggregator/OTA rates for all vendors present in the markets listed on the date of the survey.
With the help of Michael Meyer of Rate-Highway Inc. and Jim Tennant of The Tennant Group, Auto Rental News publishes monthly auto rental rate surveys for six major airports in the cities of Boston (BOS), Miami (MIA), Chicago (ORD), Houston (HOU), Seattle (SEA) and Los Angeles (LAX). The rates are based on weekly surveys and are published monthly.
Analysis and commentary provided by Jim Tennant of The Tennant Group. This survey is dated Feb. 4. There will also be a session on rates and rate management at the next Car Rental Show, April 15-16, 2013 at the Rio in Las Vegas.
Please note that some extraneous data was inadvertently included in the last four months of surveys. Results for September through December 2012 have been revised, although only the December revision was significant.
The strong year-over-year results that we saw in November and December continued into January. While not as strong as December, the January 2013 increase of $6.27 over the previous year is still an impressive result.
Boston and Chicago continued to have double digit year-over-year increases and only Seattle had a small decrease from last year. The year-to-comparisons of Jun 2012 through January 2013 is available below.
Year-to-Year Comparisons | ||||||||
|---|---|---|---|---|---|---|---|---|
Jun | Jul | Aug | Sep | Oct | Nov | Dec | Jan | |
BOS | (8.65) | (16.74) | (0.21) | 1.14 | 1.52 | 10.11 | 24.44 | 12.32 |
MIA | (25.58) | (24.27) | (11.98) | (6.02) | (9.79) | (7.28) | 11.67 | 5.74 |
ORD | 0.11 | (2.86) | 22.96 | 6.24 | 10.64 | 28.72 | 37.24 | 12.14 |
HOU | (4.75) | (5.01) | (6.54) | (9.46) | (4.50) | (2.88) | 2.88 | (2.76) |
SEA | (20.34) | (23.25) | (22.59) | (2.29) | 0.53 | 7.10 | 19.31 | 4.90 |
LAX | (14.32) | 1.90 | (7.87) | (5.50) | (7.91) | 4.11 | 9.64 | 5.29 |
6-City Avg.* | (12.25) | (11.71) | (4.37) | (2.65) | (1.58) | 6.65 | 17.53 | 6.27 |
*This is the total 6-city average compared year-over-year, not the average difference of each month.
More Rental Operations

Stop Losing Money On Rental Tolls
Regardless of your rental fleet size and structure, fleet managers, executives, and owners can gain valuable insights into an often-overlooked area of fleet operations.
Read More →
Rethink The Future To Avert A Race To The Bottom
Rental car operators heard a sobering industry message and a stern challenge at the close of the International Car Rental Show.
Read More →
DriveItAway, Free2move Plan Shared Fleet Program for Independent Rental Fleet Operators
Vehicles would be placed with participating rental operations to support car renter demand and provide additional fleet capacity.
Read More →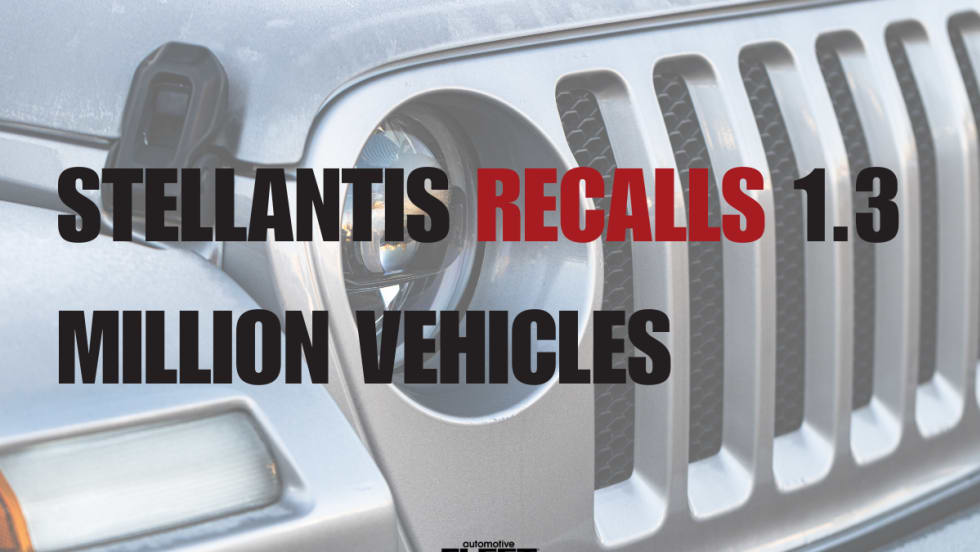
Stellantis Recalls 1.3 Million Jeep Vehicles Worldwide Over Fire Risk
Stellantis is recalling more than 1.3 million Jeep Wrangler and Gladiator models worldwide over a fire risk linked to power steering pump wiring.
Read More →
Green Motion And U-Save Open Rental Operations In Guatemala
The brands will open their first rental car outlets in the country at La Aurora International Airport in Guatemala City.
Read More →
U.S. Business Travel Drives $623 Billion+ in Economic Impact as Spending Reaches $538 Billion
The data also underscores the industry’s strong multiplier effect across the U.S. economy, revealing that each dollar invested in business travel in 2024 generated $1.16 in GDP.
Read More →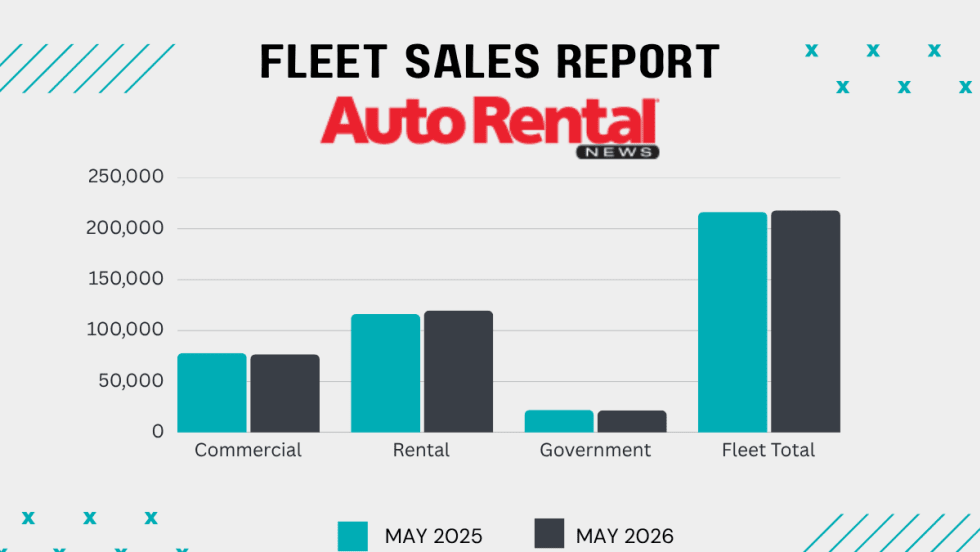
Rental Fleet Sales Skating Just Above 2025 Levels
The U.S. economy's continued growth and positive business investment are creating a favorable environment for fleet vehicle demand.
Read More →
Grow Your Rental Business Beyond Cars
Rental fleet operations are facing numerous evolving challenges and opportunities from AI technology to rate and revenue management, to customer service and business growth.
Read More →
Using AI to Create Clarity, Not Conflict, in Rental Car Damage
Rental companies still need people, policy, judgment, and thoughtful implementation, with operators remaining in control of the customer experience.
Read More →
Get Ready To Roll: No Stopping Self-Driving Rental Cars
The autonomous mobility technology revolution will move at its own pace, but sooner rather than later.
Read More →