


GBTA: Best and Worst Travel Taxes in U.S.
The Global Business Travel Association (GBTA) Foundation's annual report examines hotel lodging, car rentals and restaurant meal taxes in the top 50 U.S. destination cities in 2013.
Taxes charged specifically on travel-related services increased the total tax bill for a traveler by 58% in 2013, according to a new report by the GBTA Foundation, the education and research foundation of the Global Business Travel Association (GBTA).
The annual study examines hotel lodging, car rentals and restaurant meal taxes in the top 50 U.S. destination cities, which are regularly used to fund local projects unrelated to tourism and business travel.
“Unfortunately, it’s not just state and local governments that see business travelers as their cash cow — the federal government is getting in the game,” said Michael W. McCormick, GBTA executive director and COO. “Congress may consider a doubling of the TSA tax. Instead of driving TSA efficiencies that curb spending, Congress’ solution is to double the amount travelers pay. Road warriors strengthen the economy, create jobs and drive economic security. Yet governments insist on treating travelers like their ATM.”
“These types of punitive travel taxes will ultimately push business travelers to stay home, and we all pay when governments take a short-sighted approach that raises the costs for business travel,” added McCormick.
According to the GBTA Foundation, the study presents several views of travel taxes to help readers make informed choices. The top 50 markets are ranked by overall travel tax burden, including general sales tax and discriminatory travel taxes, and by discriminatory travel tax burden — excluding general sales taxes to count only taxes that target car rentals, hotel stays and meals.
Total Travel Tax Burden
According to the GBTA Foundation, the top 10 U.S. cities where travelers incur the highest total tax burden in central city locations, factoring in general sales taxes and discriminatory travel taxes:
Rank in | Highest Total Tax Burden | Combined single day travel taxes | Rank in |
|---|---|---|---|
2013 | 2012 | ||
1 | Chicago, IL | $41.04 | 1 |
2 | New York, NY | $38.65 | 2 |
3 | Minneapolis, MN | $36.70 | 6 |
4 | Kansas City, MO | $36.61 | 4 |
5 | Indianapolis, IN | $36.00 | 8 |
6 | Cleveland, OH | $35.41 | 7 |
7 | Boston, MA | $35.32 | 3 |
8 | Seattle, WA | $35.11 | 5 |
9 | Nashville, TN | $34.75 | 9 |
10 | Houston, TX | $34.16 | 10 |
The top 10 U.S. cities where travelers incur the lowest total tax burden in central city locations, factoring in general sales taxes and discriminatory travel taxes:
Rank in | Lowest Total Tax Burden | Combined single day travel taxes | Rank in |
|---|---|---|---|
2013 | 2012 | ||
1 | Fort Lauderdale, FL | $22.61 | 1 |
2 | Fort Myers, FL | $22.61 | 2 |
3 | West Palm Beach, FL | $22.61 | 3 |
4 | Detroit, MI | $22.80 | 4 |
5 | Portland, OR | $22.86 | 5 |
6 | Orange County, CA | $23.61 | 6 |
7 | Burbank, CA | $24.59 | 7 |
8 | Honolulu, HI | $24.67 | 9 |
9 | Ontario, CA | $24.93 | 8 |
10 | Orlando, FL | $24.94 | 10 |
Discriminatory Travel Tax Burden
Discriminatory travel taxes are those imposed specifically on travel services above and beyond general sales taxes. California and Florida are among the states with the lowest discriminatory travel tax rates in the country, according to the GBTA Foundation.
The top 10 U.S. cities with the highest discriminatory travel tax rates in central city locations:
Rank in 2013 | Highest discriminatory travel tax rates | Discriminatory increase over general sales tax | Rank in 2012 |
|---|---|---|---|
1 | Portland, OR | $22.86 | 1 |
2 | Boston, MA | $19.34 | 2 |
3 | Indianapolis, IN | $18.10 | 3 |
4 | Minneapolis, MN | $17.46 | 6 |
5 | Chicago, IL | $17.39 | 4 |
6 | New York, NY | $15.96 | 5 |
7 | Washington, DC | $15.61 | 11 |
8 | Kansas City, MO | $15.26 | 7 |
9 | Charlotte, NC | $15.16 | 8 |
10 | Milwaukee, WI | $15.04 | 10 |
The top 10 U.S. cities with the lowest discriminatory travel tax rates in central city locations:
Rank in 2013 | Lowest discriminatory travel tax rates | Discriminatory increase over general sales tax | Rank in 2012 |
|---|---|---|---|
1 | Burbank, CA | $1.58 | 1 |
2 | Orange County, CA | $3.16 | 2 |
3 | Ontario, CA | $4.48 | 3 |
4 | San Diego, CA | $5.27 | 4 |
5 | Oakland, CA | $5.79 | 6 |
tie | Tampa, FL | $7.27 | 7 |
tie | Fort Lauderdale, FL | $7.27 | 8 |
tie | Fort Myers, FL | $7.27 | 9 |
tie | West Palm Beach. FL | $7.27 | 10 |
10 | Los Angeles, CA | $7.37 | 5 |
“Municipalities are under pressure to raise revenue wherever they can, but imposing too heavy a tax burden on business travel is a shortsighted strategy,” said Joseph Bates, GBTA Foundation’s vice president of research. “With taxes rising in every area of society, companies and travel managers are taking an increasingly hard look at the price they’re being asked to pay to visit any given city or region.”
“Rising car rental taxes helped boost travel taxes among cities where travelers already face some of the highest total tax burdens in the country. The recent 3% increase in the Motor Vehicle Rental Tax in Minneapolis and the 2% increase in the Auto Rental Excise Tax in Indianapolis pushed these cities toward the top of the high-tax group for 2013,” added Bates.
More Rental Operations

Stop Losing Money On Rental Tolls
Regardless of your rental fleet size and structure, fleet managers, executives, and owners can gain valuable insights into an often-overlooked area of fleet operations.
Read More →
Rethink The Future To Avert A Race To The Bottom
Rental car operators heard a sobering industry message and a stern challenge at the close of the International Car Rental Show.
Read More →
DriveItAway, Free2move Plan Shared Fleet Program for Independent Rental Fleet Operators
Vehicles would be placed with participating rental operations to support car renter demand and provide additional fleet capacity.
Read More →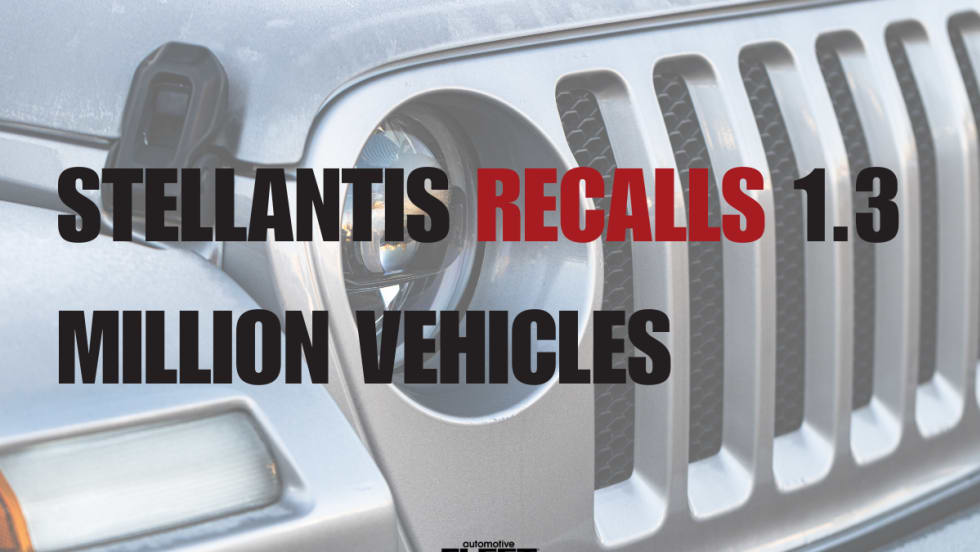
Stellantis Recalls 1.3 Million Jeep Vehicles Worldwide Over Fire Risk
Stellantis is recalling more than 1.3 million Jeep Wrangler and Gladiator models worldwide over a fire risk linked to power steering pump wiring.
Read More →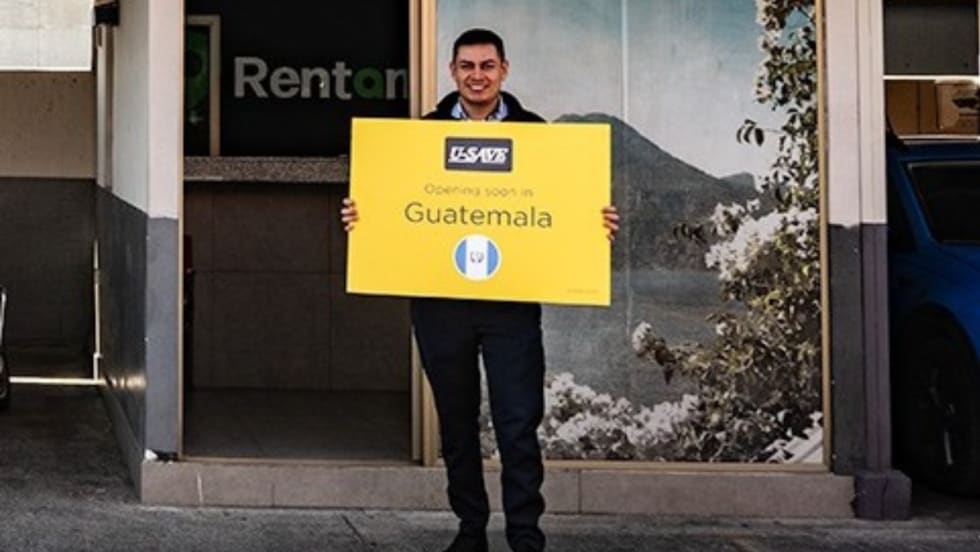
Green Motion And U-Save Open Rental Operations In Guatemala
The brands will open their first rental car outlets in the country at La Aurora International Airport in Guatemala City.
Read More →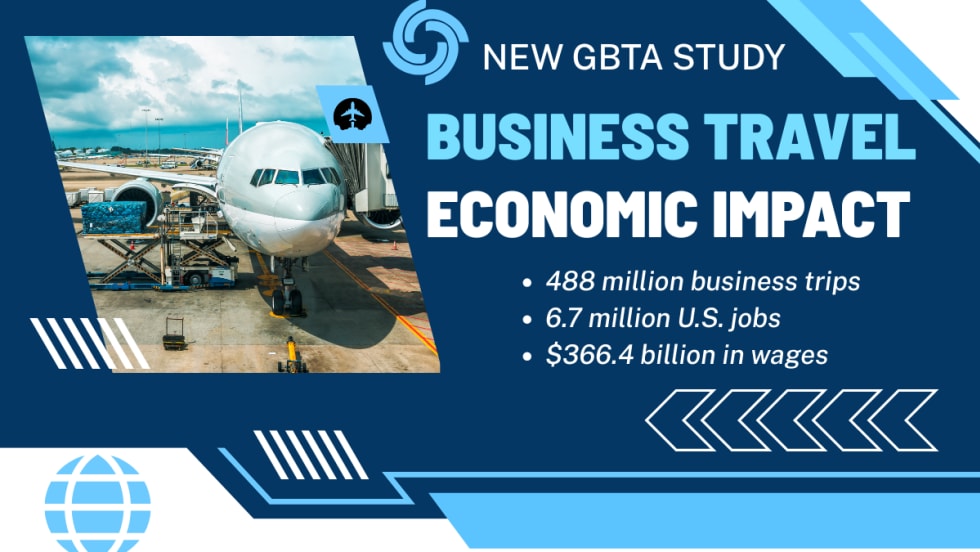
U.S. Business Travel Drives $623 Billion+ in Economic Impact as Spending Reaches $538 Billion
The data also underscores the industry’s strong multiplier effect across the U.S. economy, revealing that each dollar invested in business travel in 2024 generated $1.16 in GDP.
Read More →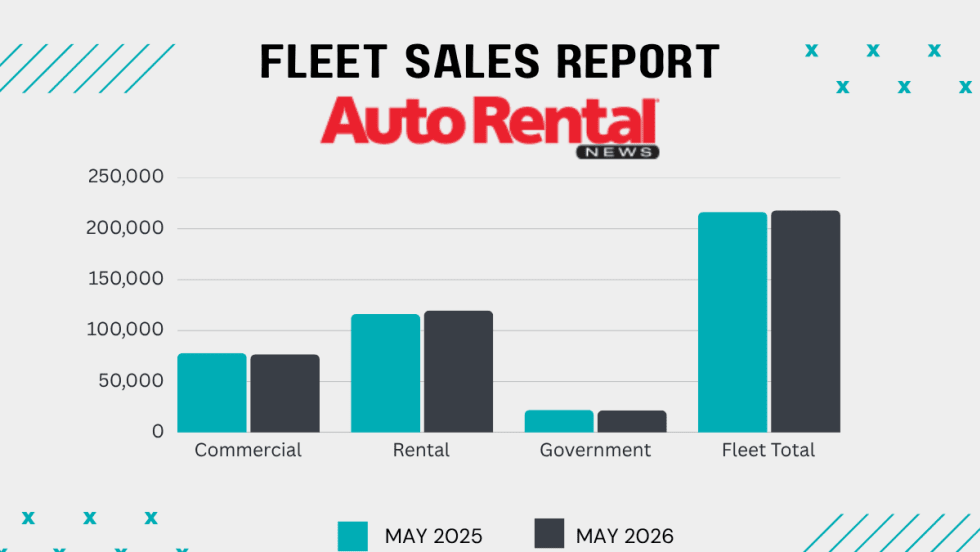
Rental Fleet Sales Skating Just Above 2025 Levels
The U.S. economy's continued growth and positive business investment are creating a favorable environment for fleet vehicle demand.
Read More →
Grow Your Rental Business Beyond Cars
Rental fleet operations are facing numerous evolving challenges and opportunities from AI technology to rate and revenue management, to customer service and business growth.
Read More →
Using AI to Create Clarity, Not Conflict, in Rental Car Damage
Rental companies still need people, policy, judgment, and thoughtful implementation, with operators remaining in control of the customer experience.
Read More →
Get Ready To Roll: No Stopping Self-Driving Rental Cars
The autonomous mobility technology revolution will move at its own pace, but sooner rather than later.
Read More →