





Related: Angry Travelers Face Long Lines at LAX's New Rideshare Pickup
Top Airports with the Longest Delays
According to flight data from USAFacts, Newark Liberty International Airport had the most flight delays with 26.5% of flights taking off late. In 2019, July had the highest number of flight delays per month with an average delay of 76 minutes.
January 14, 2020
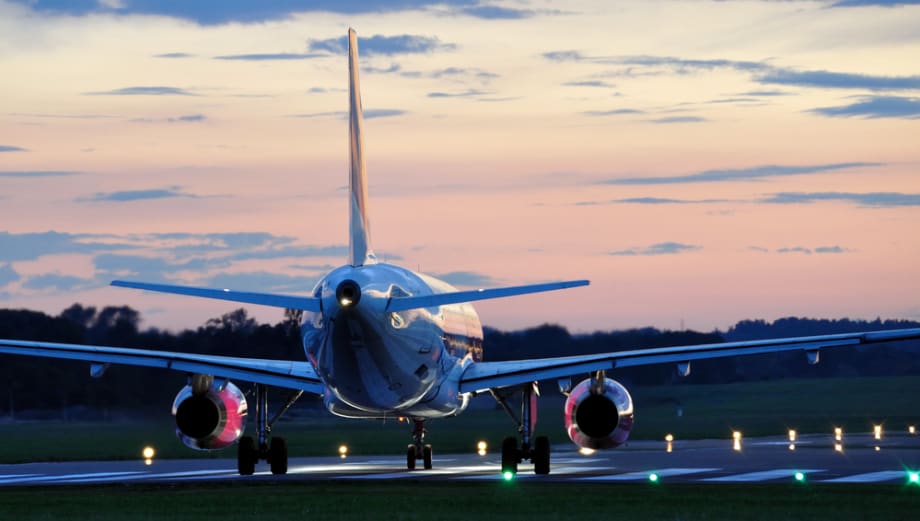
At the nation’s 30 busiest airports, Newark Liberty International Airport takes the No. 1 spot with 26.5% of all flights taking off late.
Photo via Depositphotos.
2 min to read
Within in the U.S., the average flight arrives 14 minutes after a scheduled arrival. Approximately 7% of all flights arrived more than an hour late.
USAFacts calculated the percentage of flights delayed – and the average length of those delays – at U.S. airports between October 2018 and September 2019 by looking at data from the U.S. Bureau of Transportation Statistics, part of the U.S. Department of Transportation.
At the nation’s 30 busiest airports, Newark Liberty International Airport takes the No. 1 spot with 26.5% of all flights taking off late, according to flight data. Newark also had the longest average delay time – 22 minutes per flight. The No. 2 spot goes to New York’s LaGuardia Airport with 24.5% of all flights leaving late and averaging 19.6 minutes per flight delay.
Other airports with the worst flight delays include: Chicago O’Hare International Airport with 25.5% of all flights leaving late (19.2 minutes per flight delay); Boston’s Logan International Airport (22% of all flights delayed, 17.3 minutes per flight delay); Dallas Fort Worth International Airport (23.3% of all flights delayed, 16.5 minutes per flight delay); San Francisco International Airport (22.4% of all flights delayed, 16.2 minutes per flight delay); Fort Lauderdale-Hollywood International Airport (21.9% of all flights delayed; 16.3 minutes per flight delay); Denver International Airport (21.6% of all flights delayed; 15.3 minutes per flight delay); Miami International Airport (21.6% of all flights delayed; 15.3 minutes per flight delay); Chicago Midway Airport (22% of all flights delayed; 13.4 minutes per flight delay).
Poor weather conditions, late aircraft, carrier related (baggage, fueling, or maintenance problems), and airspace system issues make up the top reasons for flight delays, according to USAFacts. Late aircraft is the most common cause for flight delays.
With a lot of flights in the summer, the summer months have the highest average flight delays. July has the highest delay of 76 minutes followed by June with an average of 72 minutes and August with an average of 71 minutes.
Honolulu International Airport was named as the top airport with the fewest delays with 10.5% of all flights leaving late and an average of 6.8 minutes per flight delay. Anchorage International Airport came in second with 11% of all flights delayed and an average of 7.1 minutes per flight delay.
The Department of Transportation identifies a late flight as a plane arriving at least 15 minutes after its scheduled arrival.
More Rental Operations

What Does It Take to Succeed in B2B Rentals?
The fundamentals may be familiar to daily car rental operators, but project-based truck rentals put different demands on the fleet and the business.
Read More →
NPR Builds on International Partnerships to Grow Rental Bookings
With Ana Laborde supporting broker development, NPR Auto Group is tailoring distribution strategies, rate packages, and partnerships to grow international reservations across its three brands.
Read More →
Advantage, Sixt Place Among Top Five in Annual Satisfaction Study
While Enterprise and National retain the top spots in JD Power’s 2026 rankings, the latest customer satisfaction results suggest renters can find competitive service beyond the biggest car rental names.
Read More →
The $100,000 Insurance Trap in Exotic Car Rentals
Exotic rental agencies often rely on customers’ personal auto policies to protect six-figure vehicles. But policy language can dramatically change the coverage for vehicles over $100,000 MSRP.
Read More →
The Booking Is Confirmed, But Is Your Customer Ready to Drive?
For international renters, a confirmed reservation doesn’t always mean they’re eligible to drive. Earlier checks can help operators catch documentation and payment issues before the customer reaches the counter.
Read More →
ICRS 2027 Opens Call for Papers
The International Car Rental Show seeks session proposals on the business, operational, and technology issues facing car rental operators. Submissions are due Jan. 15.
Read More →
Turo to Launch Vehicle Delivery Service
Turo Delivered will let travelers search for vehicles that hosts can deliver directly to hotels, homes, airports, train stations, and other locations.
Read More →
Palm Beach Airport Code Change Creates Car Rental Distribution Gap
A test of rental searches under the old PBI and new DJT airport codes returned largely different sets of brands and vehicles, highlighting a potential distribution problem for rental operators.
Read More →
U-Save Continues Dominican Republic Expansion with Launch in Punta Cana
The new franchise location builds on U-Save’s existing Santo Domingo operation and will begin taking reservations for October 2026.
Read More →
When AI Books the Rental Car, Who Controls the Sale?
As AI moves from comparing rental rates to completing transactions, operators need to understand how travelers find, interpret, rank, and ultimately see their offers. (Part 2 of 2.)
Read More →